PNC Bank 2014 Annual Report Download - page 61
Download and view the complete annual report
Please find page 61 of the 2014 PNC Bank annual report below. You can navigate through the pages in the report by either clicking on the pages listed below, or by using the keyword search tool below to find specific information within the annual report.-
 1
1 -
2
-
3
-
4
-
5
-
6
-
7
-
8
-
9
-
10
-
11
-
12
-
13
-
14
-
15
-
16
-
17
-
18
-
19
-
20
-
21
-
22
-
23
-
24
-
25
-
26
-
27
-
28
-
29
-
30
-
31
-
32
-
33
-
34
-
35
-
36
-
37
-
38
-
39
-
40
-
41
-
42
-
43
-
44
-
45
-
46
-
47
-
48
-
49
-
50
-
 51
51 -
 52
52 -
 53
53 -
 54
54 -
 55
55 -
 56
56 -
 57
57 -
 58
58 -
 59
59 -
 60
60 -
 61
61 -
 62
62 -
 63
63 -
 64
64 -
 65
65 -
 66
66 -
 67
67 -
 68
68 -
 69
69 -
 70
70 -
 71
71 -
72
-
73
-
74
-
75
-
76
-
77
-
78
-
79
-
80
-
81
-
82
-
83
-
84
-
85
-
86
-
87
-
88
-
89
-
90
-
91
-
92
-
93
-
94
-
95
-
96
-
97
-
98
-
99
-
100
-
101
-
102
-
103
-
104
-
105
-
106
-
107
-
108
-
109
-
110
-
111
-
112
-
113
-
114
-
115
-
116
-
117
-
118
-
119
-
120
-
121
-
122
-
123
-
124
-
125
-
126
-
127
-
128
-
129
-
130
-
131
-
132
-
133
-
134
-
135
-
136
-
137
-
138
-
139
-
140
-
141
-
142
-
143
-
144
-
145
-
146
-
147
-
148
-
149
-
150
-
151
-
152
-
153
-
154
-
155
-
156
-
157
-
158
-
159
-
160
-
161
-
162
-
163
-
164
-
165
-
166
-
167
-
168
-
169
-
170
-
171
-
172
-
173
-
174
-
175
-
176
-
177
-
178
-
179
-
180
-
181
-
182
-
183
-
184
-
185
-
186
-
187
-
188
-
189
-
190
-
191
-
192
-
193
-
194
-
195
-
196
-
197
-
198
-
199
-
200
-
201
-
202
-
203
-
204
-
205
-
206
-
207
-
208
-
209
-
210
-
211
-
212
-
213
-
214
-
215
-
216
-
217
-
218
-
219
-
220
-
221
-
222
-
223
-
224
-
225
-
226
-
227
-
228
-
229
-
230
-
231
-
232
-
233
-
234
-
235
-
236
-
237
-
238
-
239
-
240
-
241
-
242
-
243
-
244
-
245
-
246
-
247
-
248
-
249
-
250
-
251
-
252
-
253
-
254
-
255
-
256
-
257
-
258
-
259
-
260
-
261
-
262
-
263
-
264
-
265
-
266
-
267
-
268
 |
 |

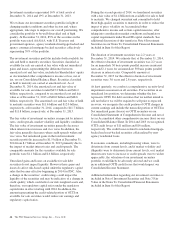
The present value impact of declining cash flows is primarily
reflected as an immediate impairment charge to the provision
for credit losses, resulting in an increase to the allowance for
loan and lease losses. The present value impact of increased
cash flows is first recognized as a reversal of the allowance
with any additional cash flow increases reflected as an
increase in accretable yield over the life of the loan.
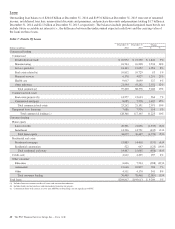
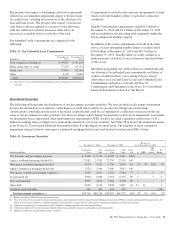
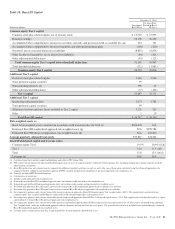
Net unfunded credit commitments are comprised of the
following:
Table 13: Net Unfunded Loan Commitments
In millions
December 31
2014
December 31
2013
Total commercial lending (a) $ 99,837 $ 90,104
Home equity lines of credit 17,839 18,754
Credit card 17,833 16,746
Other 4,178 4,266
Total $139,687 $129,870
(a) Less than 5% of net unfunded loan commitments relate to commercial real estate at
each date.
Commitments to extend credit represent arrangements to lend
funds or provide liquidity subject to specified contractual
conditions.
Standby bond purchase agreements totaled $1.1 billion at
December 31, 2014 and $1.3 billion at December 31, 2013
and are included in the preceding table, primarily within the
Total commercial lending category.
In addition to the credit commitments set forth in the table
above, our net outstanding standby letters of credit totaled
$10.0 billion at December 31, 2014 and $10.5 billion at
December 31, 2013. Standby letters of credit commit us to
make payments on behalf of our customers if specified future
events occur.
Information regarding our credit extension commitments and
our allowance for unfunded loan commitments and letters of
credit is included in Note 1 Accounting Policies, Note 5
Allowances for Loan and Lease Losses and Unfunded Loan
Commitments and Letters of Credit and Note 22
Commitments and Guarantees in the Notes To Consolidated
Financial Statements in Item 8 of this Report.
Investment Securities
The following table presents the distribution of our investment securities portfolio. We have included credit ratings information
because the information is an indicator of the degree of credit risk to which we are exposed. Changes in credit ratings
classifications could indicate increased or decreased credit risk and could be accompanied by a reduction or increase in the fair
value of our investment securities portfolio. For those securities, where during our quarterly security-level impairment assessments
we determined losses represented other-than-temporary impairment (OTTI), we have recorded cumulative credit losses of $1.2
billion in earnings and accordingly have reduced the amortized cost of our securities. See Table 78 in Note 6 Investment Securities
in the Notes To Consolidated Financial Statements in Item 8 of this Report for more detail. The majority of these cumulative
impairment charges related to non-agency residential mortgage-backed and asset-backed securities rated BB or lower.
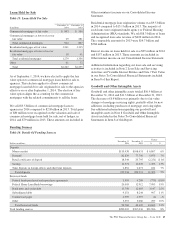
Table 14: Investment Securities
December 31, 2014 December 31, 2013
Ratings (a)
As of December 31, 2014
Dollars in millions
Amortized
Cost
Fair
Value
Amortized
Cost
Fair
Value
AAA/
AA A BBB
BB
and
Lower
No
Rating
U.S. Treasury and government agencies $ 5,485 $ 5,714 $ 4,229 $ 4,361 100%
Agency residential mortgage-backed (b) 23,382 23,935 27,370 27,535 100
Non-agency residential mortgage-backed 4,993 5,225 5,750 5,894 10 1% 3% 81% 5%
Agency commercial mortgage-backed (b) 3,378 3,440 2,996 3,063 100
Non-agency commercial mortgage-backed (c) 5,095 5,191 5,624 5,744 77 7 7 4 5
Asset-backed (d) 5,900 5,940 6,763 6,773 90 2 7 1
State and municipal 3,995 4,191 3,664 3,678 86 7 7
Other debt 2,099 2,142 2,845 2,891 65 23 11 1
Corporate stock and other 442 441 434 433 100
Total investment securities (e) $54,769 $56,219 $59,675 $60,372 85% 2% 1% 10% 2%
(a) Ratings percentages allocated based on amortized cost.
(b) These line items were corrected for the prior period due to a misclassification of Government National Mortgage Association (GNMA) securities collateralized by project loans. $1.1
billion was previously reported as residential mortgage-backed agency securities and was reclassified to commercial mortgage-backed agency securities.
(c) Collateralized primarily by retail properties, office buildings, lodging properties and multi-family housing.
(d) Collateralized primarily by government guaranteed student loans and other consumer credit products and corporate debt.
(e) Includes available for sale and held to maturity securities.
The PNC Financial Services Group, Inc. – Form 10-K 43