PNC Bank 2014 Annual Report Download - page 116
Download and view the complete annual report
Please find page 116 of the 2014 PNC Bank annual report below. You can navigate through the pages in the report by either clicking on the pages listed below, or by using the keyword search tool below to find specific information within the annual report.-
 1
1 -
2
-
3
-
4
-
5
-
6
-
7
-
8
-
9
-
10
-
11
-
12
-
13
-
14
-
15
-
16
-
17
-
18
-
19
-
20
-
21
-
22
-
23
-
24
-
25
-
26
-
27
-
28
-
29
-
30
-
31
-
32
-
33
-
34
-
35
-
36
-
37
-
38
-
39
-
40
-
41
-
42
-
43
-
44
-
45
-
46
-
47
-
48
-
49
-
50
-
51
-
52
-
53
-
54
-
55
-
56
-
57
-
58
-
59
-
60
-
61
-
62
-
63
-
64
-
65
-
66
-
67
-
68
-
69
-
70
-
71
-
72
-
73
-
74
-
75
-
76
-
77
-
78
-
79
-
80
-
81
-
82
-
83
-
84
-
85
-
86
-
87
-
88
-
89
-
90
-
91
-
92
-
93
-
94
-
95
-
96
-
97
-
98
-
99
-
100
-
101
-
102
-
103
-
104
-
105
-
 106
106 -
 107
107 -
 108
108 -
 109
109 -
 110
110 -
 111
111 -
 112
112 -
 113
113 -
 114
114 -
 115
115 -
 116
116 -
 117
117 -
 118
118 -
 119
119 -
 120
120 -
 121
121 -
 122
122 -
 123
123 -
 124
124 -
 125
125 -
 126
126 -
127
-
128
-
129
-
130
-
131
-
132
-
133
-
134
-
135
-
136
-
137
-
138
-
139
-
140
-
141
-
142
-
143
-
144
-
145
-
146
-
147
-
148
-
149
-
150
-
151
-
152
-
153
-
154
-
155
-
156
-
157
-
158
-
159
-
160
-
161
-
162
-
163
-
164
-
165
-
166
-
167
-
168
-
169
-
170
-
171
-
172
-
173
-
174
-
175
-
176
-
177
-
178
-
179
-
180
-
181
-
182
-
183
-
184
-
185
-
186
-
187
-
188
-
189
-
190
-
191
-
192
-
193
-
194
-
195
-
196
-
197
-
198
-
199
-
200
-
201
-
202
-
203
-
204
-
205
-
206
-
207
-
208
-
209
-
210
-
211
-
212
-
213
-
214
-
215
-
216
-
217
-
218
-
219
-
220
-
221
-
222
-
223
-
224
-
225
-
226
-
227
-
228
-
229
-
230
-
231
-
232
-
233
-
234
-
235
-
236
-
237
-
238
-
239
-
240
-
241
-
242
-
243
-
244
-
245
-
246
-
247
-
248
-
249
-
250
-
251
-
252
-
253
-
254
-
255
-
256
-
257
-
258
-
259
-
260
-
261
-
262
-
263
-
264
-
265
-
266
-
267
-
268
 |
 |
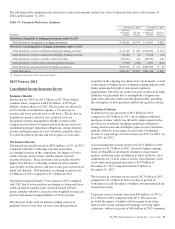
Funding Sources
Total funding sources increased $13.0 billion to $267.0 billion
at December 31, 2013 compared with December 31, 2012.
Total deposits increased $7.8 billion at December 31, 2013
compared with December 31, 2012 due to increases in money
market, demand, and savings accounts, partially offset by
decreases in retail certificates of deposit. Interest-bearing
deposits represented 68% of total deposits at December 31,
2013 compared to 67% at December 31, 2012
Average total deposits increased $10.6 billion to $212.2
billion in 2013 compared with the prior year, primarily due to
an increase of $15.0 billion in average transaction deposits,
which grew to $176.9 billion in 2013. Higher average interest-
bearing demand deposits, average money market deposits and
average noninterest-bearing deposits drove the increase in
average transaction deposits. These increases were partially
offset by a decrease of $4.3 billion in average retail
certificates of deposit attributable to runoff of maturing
accounts. Average total deposits represented 69% of average
total assets for 2013 and 68% for 2012.
Total borrowed funds increased $5.2 billion to $46.1 billion at
December 31, 2013 as higher Federal Home Loan Bank
borrowings and bank notes and senior debt were partially
offset by a decrease in commercial paper.
Average borrowed funds were $40.0 billion in 2013 compared
with $41.8 billion in 2012. The decrease was primarily due to
lower average commercial paper, lower average Federal Home
Loan Bank (FHLB) borrowings and lower average federal
funds purchased and repurchase agreements.
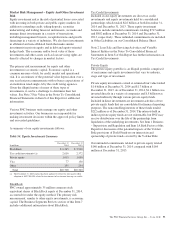
Shareholders’ Equity
Total shareholders’ equity increased $3.4 billion, to $42.3
billion at December 31, 2013 compared with December 31,
2012, primarily reflecting an increase in retained earnings of
$3.0 billion (driven by net income of $4.2 billion and the
impact of $1.1 billion of common and preferred dividends
declared) and an increase of $.6 billion in capital surplus due
to the net issuances of preferred stock and common stock and
other. These increases were partially offset by the decline of
accumulated other comprehensive income of $.4 billion. This
decline was primarily due to the impact of an increase in
market interest rates and widening asset spreads on securities
available for sale and derivatives that are part of cash flow
hedging strategies, partially offset by the impact of pension
and other postretirement benefit plan adjustments. Common
shares outstanding were 533 million at December 31, 2013
and 528 million at December 31, 2012.
Risk-Based Capital
Regulatory Basel I capital ratios at December 31, 2013 were
10.5% for Tier 1 common, 11.1% for leverage, 12.4% for Tier
1 risk-based and 15.8% for total risk-based capital. At
December 31, 2012, the Basel I regulatory capital ratios were
9.6% for Tier 1 common, 10.4% for leverage, 11.6% for Tier
1 risk-based and 14.7% for total risk-based capital. The Basel
I capital ratios increased in all comparisons primarily due to
growth in retained earnings. The net issuance of preferred
stock during 2013 partially offset by the redemption of trust
preferred securities favorably impacted the December 31,
2013 Basel I Tier 1 risk-based and Basel I total risk-based
capital ratios. Basel I risk-weighted assets increased $11.3
billion to $272.2 billion at December 31, 2013 compared to
December 31, 2012.
98 The PNC Financial Services Group, Inc. – Form 10-K