PNC Bank 2014 Annual Report Download - page 72
Download and view the complete annual report
Please find page 72 of the 2014 PNC Bank annual report below. You can navigate through the pages in the report by either clicking on the pages listed below, or by using the keyword search tool below to find specific information within the annual report.-
 1
1 -
2
-
3
-
4
-
5
-
6
-
7
-
8
-
9
-
10
-
11
-
12
-
13
-
14
-
15
-
16
-
17
-
18
-
19
-
20
-
21
-
22
-
23
-
24
-
25
-
26
-
27
-
28
-
29
-
30
-
31
-
32
-
33
-
34
-
35
-
36
-
37
-
38
-
39
-
40
-
41
-
42
-
43
-
44
-
45
-
46
-
47
-
48
-
49
-
50
-
51
-
52
-
53
-
54
-
55
-
56
-
57
-
58
-
59
-
60
-
61
-
 62
62 -
 63
63 -
 64
64 -
 65
65 -
 66
66 -
 67
67 -
 68
68 -
 69
69 -
 70
70 -
 71
71 -
 72
72 -
 73
73 -
 74
74 -
 75
75 -
 76
76 -
 77
77 -
 78
78 -
 79
79 -
 80
80 -
 81
81 -
 82
82 -
83
-
84
-
85
-
86
-
87
-
88
-
89
-
90
-
91
-
92
-
93
-
94
-
95
-
96
-
97
-
98
-
99
-
100
-
101
-
102
-
103
-
104
-
105
-
106
-
107
-
108
-
109
-
110
-
111
-
112
-
113
-
114
-
115
-
116
-
117
-
118
-
119
-
120
-
121
-
122
-
123
-
124
-
125
-
126
-
127
-
128
-
129
-
130
-
131
-
132
-
133
-
134
-
135
-
136
-
137
-
138
-
139
-
140
-
141
-
142
-
143
-
144
-
145
-
146
-
147
-
148
-
149
-
150
-
151
-
152
-
153
-
154
-
155
-
156
-
157
-
158
-
159
-
160
-
161
-
162
-
163
-
164
-
165
-
166
-
167
-
168
-
169
-
170
-
171
-
172
-
173
-
174
-
175
-
176
-
177
-
178
-
179
-
180
-
181
-
182
-
183
-
184
-
185
-
186
-
187
-
188
-
189
-
190
-
191
-
192
-
193
-
194
-
195
-
196
-
197
-
198
-
199
-
200
-
201
-
202
-
203
-
204
-
205
-
206
-
207
-
208
-
209
-
210
-
211
-
212
-
213
-
214
-
215
-
216
-
217
-
218
-
219
-
220
-
221
-
222
-
223
-
224
-
225
-
226
-
227
-
228
-
229
-
230
-
231
-
232
-
233
-
234
-
235
-
236
-
237
-
238
-
239
-
240
-
241
-
242
-
243
-
244
-
245
-
246
-
247
-
248
-
249
-
250
-
251
-
252
-
253
-
254
-
255
-
256
-
257
-
258
-
259
-
260
-
261
-
262
-
263
-
264
-
265
-
266
-
267
-
268
 |
 |

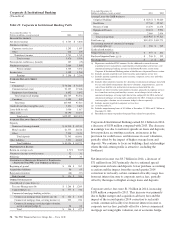
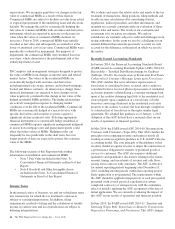
Corporate & Institutional Banking
(Unaudited)
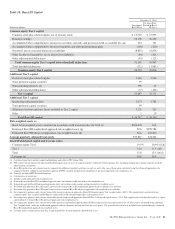
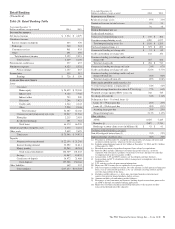
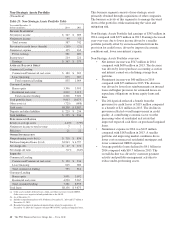
Table 21: Corporate & Institutional Banking Table
Year ended December 31
Dollars in millions, except as noted 2014 2013
I
NCOME
S
TATEMENT
Net interest income $ 3,733 $ 3,804
Noninterest income
Corporate service fees 1,295 1,097
Other 448 605
Noninterest income 1,743 1,702
Total revenue 5,476 5,506
Provision for credit losses (benefit) 107 (25)
Noninterest expense 2,064 1,999
Pretax earnings 3,305 3,532
Income taxes 1,199 1,268
Earnings $ 2,106 $ 2,264
A
VERAGE
B
ALANCE
S
HEET
Loans
Commercial $ 78,688 $ 72,256
Commercial real estate 21,127 17,668
Equipment lease financing 6,892 6,642
Total commercial lending 106,707 96,566
Consumer 1,198 947
Total loans 107,905 97,513
Goodwill and other intangible assets 3,826 3,804
Loans held for sale 1,006 1,017
Other assets 10,190 10,636
Total assets $122,927 $112,970
A
VERAGE
B
ALANCE
S
HEET
(C
ONTINUED
)
Deposits
Noninterest-bearing demand $ 44,210 $ 41,514
Money market 21,377 18,168
Other 7,958 7,124
Total deposits 73,545 66,806
Other liabilities 7,551 14,465
Total liabilities $ 81,096 $ 81,271
P
ERFORMANCE
R
ATIOS
Return on average assets 1.71% 2.00%
Noninterest income to total revenue 32 31
Efficiency 38 36
C
OMMERCIAL
M
ORTGAGE
S
ERVICING
P
ORTFOLIO
–S
ERVICED
F
OR
PNC
AND
O
THERS
(in billions)
Beginning of period $ 308 $ 282
Acquisitions/additions 96 83
Repayments/transfers (68) (57)
End of period $ 336 $ 308
O
THER
I
NFORMATION
Consolidated revenue from: (a)
Treasury Management (b) $ 1,288 $ 1,260
Capital Markets (c) $ 777 $ 722
Commercial mortgage banking activities
Commercial mortgage loans held for sale (d) $ 126 $ 133
Commercial mortgage loan servicing income (e) 222 226
Commercial mortgage servicing rights valuation,
net of economic hedge (f) 38 68
Total $ 386 $ 427
Year ended December 31
Dollars in millions, except as noted 2014 2013
Average Loans (by C&IB business)
Corporate Banking $ 54,341 $ 50,620
Real Estate 27,740 22,287
Business Credit 13,270 11,678
Equipment Finance 10,474 9,994
Other 2,080 2,934
Total average loans $107,905 $ 97,513
Total loans (g) $113,935 $101,773
Net carrying amount of commercial mortgage
servicing rights (g) $ 506 $ 549
Credit-related statistics:
Nonperforming assets (g) (h) $ 557 $ 804
Purchased impaired loans (g) (i) $ 246 $ 515
Net charge-offs $ 8 $ 105
(a) Represents consolidated PNC amounts. See the additional revenue discussion
regarding treasury management, capital markets-related products and services, and
commercial mortgage banking activities in the Product Revenue section of the
Corporate & Institutional Banking portion of this Business Segments Review section.
(b) Includes amounts reported in net interest income and corporate service fees.
(c) Includes amounts reported in net interest income, corporate service fees and other
noninterest income.
(d) Includes other noninterest income for valuations on commercial mortgage loans held
for sale and related commitments, derivative valuations, origination fees, gains on
sale of loans held for sale and net interest income on loans held for sale.
(e) Includes net interest income and noninterest income, primarily in corporate services
fees, from loan servicing and ancillary services, net of changes in fair value on
commercial mortgage servicing rights due to time and payoffs for 2014 and net of
commercial mortgage servicing rights amortization for 2013. Commercial mortgage
servicing rights valuation, net of economic hedge is shown separately.
(f) Includes amounts reported in corporate services fees.
(g) As of December 31.
(h) Includes nonperforming loans of $.5 billion at December 31, 2014 and $.7 billion at
December 31, 2013.
(i) Recorded investment of purchased impaired loans related to acquisitions.
Corporate & Institutional Banking earned $2.1 billion in 2014,
a decrease of $158 million compared with 2013. The decrease
in earnings was due to narrower spreads on loans and deposits,
lower purchase accounting accretion, an increase in the
provision for credit losses, and decreases in asset valuations,
partially offset by the impact of higher average loans and
deposits. We continue to focus on building client relationships
where the risk-return profile is attractive, including the
Southeast.
Net interest income was $3.7 billion in 2014, a decrease of
$71 million from 2013 primarily due to continued spread
compression on loans and deposits, lower purchase accounting
accretion and the impact from the second quarter 2014
correction to reclassify certain commercial facility usage fees
from net interest income to corporate service fees, partially
offset by the impact of higher average loans and deposits.
Corporate service fees were $1.3 billion in 2014, increasing
$198 million compared to 2013. This increase was primarily
due to higher merger and acquisition advisory fees and the
impact of the second quarter 2014 correction to reclassify
certain commercial facility fees from net interest income to
corporate service fees, partially offset by a lower commercial
mortgage servicing rights valuation, net of economic hedge.
54 The PNC Financial Services Group, Inc. – Form 10-K