PNC Bank 2014 Annual Report Download - page 246
Download and view the complete annual report
Please find page 246 of the 2014 PNC Bank annual report below. You can navigate through the pages in the report by either clicking on the pages listed below, or by using the keyword search tool below to find specific information within the annual report.-
 1
1 -
2
-
3
-
4
-
5
-
6
-
7
-
8
-
9
-
10
-
11
-
12
-
13
-
14
-
15
-
16
-
17
-
18
-
19
-
20
-
21
-
22
-
23
-
24
-
25
-
26
-
27
-
28
-
29
-
30
-
31
-
32
-
33
-
34
-
35
-
36
-
37
-
38
-
39
-
40
-
41
-
42
-
43
-
44
-
45
-
46
-
47
-
48
-
49
-
50
-
51
-
52
-
53
-
54
-
55
-
56
-
57
-
58
-
59
-
60
-
61
-
62
-
63
-
64
-
65
-
66
-
67
-
68
-
69
-
70
-
71
-
72
-
73
-
74
-
75
-
76
-
77
-
78
-
79
-
80
-
81
-
82
-
83
-
84
-
85
-
86
-
87
-
88
-
89
-
90
-
91
-
92
-
93
-
94
-
95
-
96
-
97
-
98
-
99
-
100
-
101
-
102
-
103
-
104
-
105
-
106
-
107
-
108
-
109
-
110
-
111
-
112
-
113
-
114
-
115
-
116
-
117
-
118
-
119
-
120
-
121
-
122
-
123
-
124
-
125
-
126
-
127
-
128
-
129
-
130
-
131
-
132
-
133
-
134
-
135
-
136
-
137
-
138
-
139
-
140
-
141
-
142
-
143
-
144
-
145
-
146
-
147
-
148
-
149
-
150
-
151
-
152
-
153
-
154
-
155
-
156
-
157
-
158
-
159
-
160
-
161
-
162
-
163
-
164
-
165
-
166
-
167
-
168
-
169
-
170
-
171
-
172
-
173
-
174
-
175
-
176
-
177
-
178
-
179
-
180
-
181
-
182
-
183
-
184
-
185
-
186
-
187
-
188
-
189
-
190
-
191
-
192
-
193
-
194
-
195
-
196
-
197
-
198
-
199
-
200
-
201
-
202
-
203
-
204
-
205
-
206
-
207
-
208
-
209
-
210
-
211
-
212
-
213
-
214
-
215
-
216
-
217
-
218
-
219
-
220
-
221
-
222
-
223
-
224
-
225
-
226
-
227
-
228
-
229
-
230
-
231
-
232
-
233
-
234
-
235
-
 236
236 -
 237
237 -
 238
238 -
 239
239 -
 240
240 -
 241
241 -
 242
242 -
 243
243 -
 244
244 -
 245
245 -
 246
246 -
 247
247 -
 248
248 -
 249
249 -
 250
250 -
 251
251 -
 252
252 -
 253
253 -
 254
254 -
 255
255 -
 256
256 -
257
-
258
-
259
-
260
-
261
-
262
-
263
-
264
-
265
-
266
-
267
-
268
 |
 |

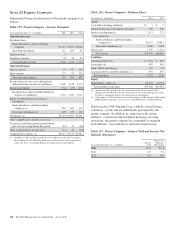
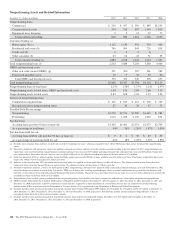
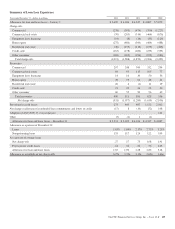
Nonperforming Assets and Related Information
December 31 – dollars in millions 2014 2013 2012 2011 2010
Nonperforming loans
Commercial $ 290 $ 457 $ 590 $ 899 $1,253
Commercial real estate 334 518 807 1,345 1,835
Equipment lease financing 2 5 13 22 77
Total commercial lending 626 980 1,410 2,266 3,165
Consumer lending (a)
Home equity (b) (c) 1,112 1,139 951 529 448
Residential real estate (b) 706 904 845 726 818
Credit card (d) 3458
Other consumer (b) 63 61 43 31 35
Total consumer lending (e) 1,884 2,108 1,844 1,294 1,301
Total nonperforming loans (f) 2,510 3,088 3,254 3,560 4,466
OREO and foreclosed assets
Other real estate owned (OREO) (g) 351 360 507 561 589
Foreclosed and other assets 19 9 33 35 68
Total OREO and foreclosed assets 370 369 540 596 657
Total nonperforming assets $2,880 $3,457 $3,794 $4,156 $5,123
Nonperforming loans to total loans 1.23% 1.58% 1.75% 2.24% 2.97%
Nonperforming assets to total loans, OREO and foreclosed assets 1.40 1.76 2.04 2.60 3.39
Nonperforming assets to total assets 0.83 1.08 1.24 1.53 1.94
Interest on nonperforming loans
Computed on original terms $ 125 $ 163 $ 212 $ 278 $ 329
Recognized prior to nonperforming status 25 30 30 47 53
Troubled Debt Restructurings
Nonperforming $1,370 $1,511 $1,589 $1,141 $ 784
Performing 1,213 1,228 1,270 1,062 874
Past due loans
Accruing loans past due 90 days or more (h) $1,105 $1,491 $2,351 $2,973 $2,709
As a percentage of total loans .54% .76% 1.26% 1.87% 1.80%
Past due loans held for sale
Accruing loans held for sale past due 90 days or more (i) $ 9 $ 4 $ 38 $ 49 $ 65
As a percentage of total loans held for sale .40% .18% 1.03% 1.67% 1.86%
(a) Excludes most consumer loans and lines of credit, not secured by residential real estate, which are charged off after 120 to 180 days past due and are not placed on nonperforming
status.
(b) Pursuant to alignment with interagency supervisory guidance on practices for loans and lines of credit related to consumer lending in the first quarter of 2013, nonperforming home
equity loans increased $214 million, nonperforming residential mortgage loans increased $187 million and nonperforming other consumer loans increased $25 million. Charge-offs
were taken on these loans where the fair value less costs to sell the collateral was less than the recorded investment of the loan and were $134 million.
(c) In the first quarter of 2012, we adopted a policy stating that Home equity loans past due 90 days or more would be placed on nonaccrual status. Prior policy required that these loans
be past due 180 days before being placed on nonaccrual status.
(d) Effective in the second quarter 2011, the commercial nonaccrual policy was applied to certain small business credit card balances. This change resulted in loans being placed on
nonaccrual status when they become 90 days or more past due. We continue to charge off these loans at 180 days past due.
(e) Pursuant to regulatory guidance, issued in the third quarter of 2012, nonperforming consumer loans, primarily home equity and residential mortgage, increased $288 million in 2012
related to changes in treatment of certain loans classified as TDRs, net of charge-offs, resulting from bankruptcy where no formal reaffirmation was provided by the borrower and
therefore a concession has been granted based upon discharge from personal liability. Charge-offs have been taken where the fair value less costs to sell the collateral was less than the
recorded investment of the loan and were $128 million.
(f) Nonperforming loans exclude certain government insured or guaranteed loans, loans held for sale, loans accounted for under the fair value option and purchased impaired loans.
(g) OREO excludes $194 million, $245 million, $380 million, $280 million and $178 million at December 31, 2014, December 31, 2013, December 31, 2012, December 31, 2011 and
December 31, 2010, respectively, related to residential real estate that was acquired by us upon foreclosure of serviced loans because they are insured by the Federal Housing
Administration (FHA) or guaranteed by the Department of Veterans Affairs (VA) or guaranteed by the Department of Housing and Urban Development.
(h) Amounts include certain government insured or guaranteed consumer loans totaling $996 million, $995 million, $2,236 million, $2,474 million and $2,167 million at December 31,
2014, December 31, 2013, December 31, 2012, December 31, 2011 and December 31, 2010, respectively. Past due loan amounts exclude purchased impaired loans as they are
considered current loans due to the accretion of interest income.
(i) Amounts include certain government insured or guaranteed consumer loans held for sale totaling $9 million, $4 million, zero, $15 million and $22 million at December 31,
2014, December 31, 2013, December 31, 2012, December 31, 2011 and December 31, 2010, respectively.
228 The PNC Financial Services Group, Inc. – Form 10-K