PNC Bank 2014 Annual Report Download - page 78
Download and view the complete annual report
Please find page 78 of the 2014 PNC Bank annual report below. You can navigate through the pages in the report by either clicking on the pages listed below, or by using the keyword search tool below to find specific information within the annual report.-
 1
1 -
2
-
3
-
4
-
5
-
6
-
7
-
8
-
9
-
10
-
11
-
12
-
13
-
14
-
15
-
16
-
17
-
18
-
19
-
20
-
21
-
22
-
23
-
24
-
25
-
26
-
27
-
28
-
29
-
30
-
31
-
32
-
33
-
34
-
35
-
36
-
37
-
38
-
39
-
40
-
41
-
42
-
43
-
44
-
45
-
46
-
47
-
48
-
49
-
50
-
51
-
52
-
53
-
54
-
55
-
56
-
57
-
58
-
59
-
60
-
61
-
62
-
63
-
64
-
65
-
66
-
67
-
 68
68 -
 69
69 -
 70
70 -
 71
71 -
 72
72 -
 73
73 -
 74
74 -
 75
75 -
 76
76 -
 77
77 -
 78
78 -
 79
79 -
 80
80 -
 81
81 -
 82
82 -
 83
83 -
 84
84 -
 85
85 -
 86
86 -
 87
87 -
 88
88 -
89
-
90
-
91
-
92
-
93
-
94
-
95
-
96
-
97
-
98
-
99
-
100
-
101
-
102
-
103
-
104
-
105
-
106
-
107
-
108
-
109
-
110
-
111
-
112
-
113
-
114
-
115
-
116
-
117
-
118
-
119
-
120
-
121
-
122
-
123
-
124
-
125
-
126
-
127
-
128
-
129
-
130
-
131
-
132
-
133
-
134
-
135
-
136
-
137
-
138
-
139
-
140
-
141
-
142
-
143
-
144
-
145
-
146
-
147
-
148
-
149
-
150
-
151
-
152
-
153
-
154
-
155
-
156
-
157
-
158
-
159
-
160
-
161
-
162
-
163
-
164
-
165
-
166
-
167
-
168
-
169
-
170
-
171
-
172
-
173
-
174
-
175
-
176
-
177
-
178
-
179
-
180
-
181
-
182
-
183
-
184
-
185
-
186
-
187
-
188
-
189
-
190
-
191
-
192
-
193
-
194
-
195
-
196
-
197
-
198
-
199
-
200
-
201
-
202
-
203
-
204
-
205
-
206
-
207
-
208
-
209
-
210
-
211
-
212
-
213
-
214
-
215
-
216
-
217
-
218
-
219
-
220
-
221
-
222
-
223
-
224
-
225
-
226
-
227
-
228
-
229
-
230
-
231
-
232
-
233
-
234
-
235
-
236
-
237
-
238
-
239
-
240
-
241
-
242
-
243
-
244
-
245
-
246
-
247
-
248
-
249
-
250
-
251
-
252
-
253
-
254
-
255
-
256
-
257
-
258
-
259
-
260
-
261
-
262
-
263
-
264
-
265
-
266
-
267
-
268
 |
 |

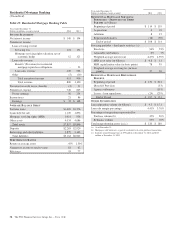
Non-Strategic Assets Portfolio
(Unaudited)
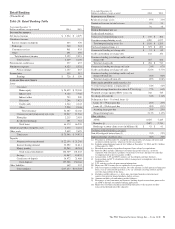
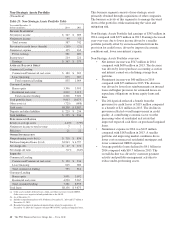
Table 25: Non-Strategic Assets Portfolio Table
Year ended December 31
Dollars in millions 2014 2013
I
NCOME
S
TATEMENT
Net interest income $ 547 $ 689
Noninterest income 40 53
Total revenue 587 742
Provision for credit losses (benefit) (119) (21)
Noninterest expense 125 163
Pretax earnings 581 600
Income taxes 214 221
Earnings $ 367 $ 379
A
VERAGE
B
ALANCE
S
HEET
Commercial Lending:
Commercial/Commercial real estate $ 180 $ 382
Lease financing 675 687
Total commercial lending 855 1,069
Consumer Lending:
Home equity 3,396 3,993
Residential real estate 4,812 5,613
Total consumer lending 8,208 9,606
Total portfolio loans 9,063 10,675
Other assets (a) (725) (688)
Total assets $8,338 $ 9,987
Deposits and other liabilities $ 225 $ 236
Total liabilities $ 225 $ 236
P
ERFORMANCE
R
ATIOS
Return on average assets 4.40% 3.79%
Noninterest income to total revenue 7 7
Efficiency 21 22
O
THER
I
NFORMATION
Nonperforming assets (b) (c) $ 710 $ 834
Purchased impaired loans (b) (d) $3,943 $ 4,797
Net charge-offs $ 47 $ 172
Net charge-off ratio .52 % 1.61%
Loans (b)
Commercial Lending
Commercial/Commercial real estate $ 130 $ 236
Lease financing 625 680
Total commercial lending 755 916
Consumer Lending
Home equity 3,091 3,692
Residential real estate 4,290 5,267
Total consumer lending 7,381 8,959
Total loans $8,136 $ 9,875
(a) Other assets includes deferred taxes, ALLL and other real estate owned (OREO).
Other assets were negative in both periods due to the ALLL.
(b) As of December 31.
(c) Includes nonperforming loans of $.6 billion at December 31, 2014 and $.7 billion at
December 31, 2013.
(d) Recorded investment of purchased impaired loans related to acquisitions. At
December 31, 2014, this segment contained 80% of PNC’s purchased impaired loans.
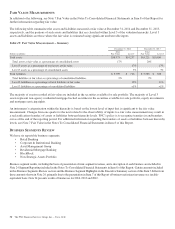
This business segment consists of non-strategic assets
primarily obtained through acquisitions of other companies.
The business activity of this segment is to manage the wind-
down of the portfolios while maximizing the value and
mitigating risk.
Non-Strategic Assets Portfolio had earnings of $367 million in
2014 compared with $379 million in 2013. Earnings decreased
year-over-year due to lower income driven by a smaller
portfolio partially offset by an increased benefit from the
provision for credit losses, driven by improved economic
conditions and, lower non-interest expense.
Non-Strategic Assets Portfolio overview:
• Net interest income was $547 million in 2014
compared with $689 million in 2013. The decrease
was driven by lower purchase accounting accretion
and interest earned on a declining average loan
portfolio.
• Noninterest income was $40 million in 2014
compared with $53 million in 2013. The decrease
was driven by lower loss reimbursements on insured
loans and higher provision for estimated losses on
repurchase obligations on home equity loans and
lines.
• The 2014 period reflected a benefit from the
provision for credit losses of $119 million compared
to a benefit of $21 million in 2013. The decline in
provision reflected overall improvement in credit
quality. A contributing economic factor was the
increasing value of residential real estate that
improved expected cash flows on purchased impaired
loans.
• Noninterest expense in 2014 was $125 million
compared with $163 million in 2013. A smaller
portfolio and improving market conditions drove
lower cost on nonaccrual residential mortgages and
lower commercial OREO expense.
• Average portfolio loans declined to $9.1 billion in
2014 compared with $10.7 billion in 2013. The
overall decline was driven by customer payment
activity and portfolio management activities to
reduce under-performing assets.
60 The PNC Financial Services Group, Inc. – Form 10-K