PNC Bank 2014 Annual Report Download - page 148
Download and view the complete annual report
Please find page 148 of the 2014 PNC Bank annual report below. You can navigate through the pages in the report by either clicking on the pages listed below, or by using the keyword search tool below to find specific information within the annual report.-
 1
1 -
2
-
3
-
4
-
5
-
6
-
7
-
8
-
9
-
10
-
11
-
12
-
13
-
14
-
15
-
16
-
17
-
18
-
19
-
20
-
21
-
22
-
23
-
24
-
25
-
26
-
27
-
28
-
29
-
30
-
31
-
32
-
33
-
34
-
35
-
36
-
37
-
38
-
39
-
40
-
41
-
42
-
43
-
44
-
45
-
46
-
47
-
48
-
49
-
50
-
51
-
52
-
53
-
54
-
55
-
56
-
57
-
58
-
59
-
60
-
61
-
62
-
63
-
64
-
65
-
66
-
67
-
68
-
69
-
70
-
71
-
72
-
73
-
74
-
75
-
76
-
77
-
78
-
79
-
80
-
81
-
82
-
83
-
84
-
85
-
86
-
87
-
88
-
89
-
90
-
91
-
92
-
93
-
94
-
95
-
96
-
97
-
98
-
99
-
100
-
101
-
102
-
103
-
104
-
105
-
106
-
107
-
108
-
109
-
110
-
111
-
112
-
113
-
114
-
115
-
116
-
117
-
118
-
119
-
120
-
121
-
122
-
123
-
124
-
125
-
126
-
127
-
128
-
129
-
130
-
131
-
132
-
133
-
134
-
135
-
136
-
137
-
 138
138 -
 139
139 -
 140
140 -
 141
141 -
 142
142 -
 143
143 -
 144
144 -
 145
145 -
 146
146 -
 147
147 -
 148
148 -
 149
149 -
 150
150 -
 151
151 -
 152
152 -
 153
153 -
 154
154 -
 155
155 -
 156
156 -
 157
157 -
 158
158 -
159
-
160
-
161
-
162
-
163
-
164
-
165
-
166
-
167
-
168
-
169
-
170
-
171
-
172
-
173
-
174
-
175
-
176
-
177
-
178
-
179
-
180
-
181
-
182
-
183
-
184
-
185
-
186
-
187
-
188
-
189
-
190
-
191
-
192
-
193
-
194
-
195
-
196
-
197
-
198
-
199
-
200
-
201
-
202
-
203
-
204
-
205
-
206
-
207
-
208
-
209
-
210
-
211
-
212
-
213
-
214
-
215
-
216
-
217
-
218
-
219
-
220
-
221
-
222
-
223
-
224
-
225
-
226
-
227
-
228
-
229
-
230
-
231
-
232
-
233
-
234
-
235
-
236
-
237
-
238
-
239
-
240
-
241
-
242
-
243
-
244
-
245
-
246
-
247
-
248
-
249
-
250
-
251
-
252
-
253
-
254
-
255
-
256
-
257
-
258
-
259
-
260
-
261
-
262
-
263
-
264
-
265
-
266
-
267
-
268
 |
 |

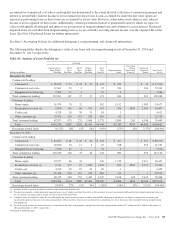
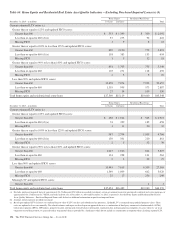
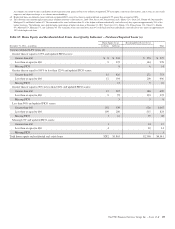
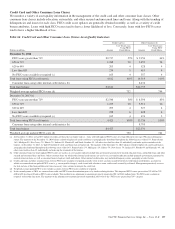
(e) Future accretable yield related to purchased impaired loans is not included in the analysis of loan portfolio.
(f) Past due loan amounts at December 31, 2014 include government insured or guaranteed Residential real estate mortgages totaling $68 million for 30 to 59 days past due, $43 million
for 60 to 89 days past due and $719 million for 90 days or more past due. Past due loan amounts at December 31, 2013 include government insured or guaranteed Residential real
estate mortgages totaling $105 million for 30 to 59 days past due, $57 million for 60 to 89 days past due and $1,025 million for 90 days or more past due.
(g) Past due loan amounts at December 31, 2014 include government insured or guaranteed Other consumer loans totaling $152 million for 30 to 59 days past due, $93 million for 60 to
89 days past due and $277 million for 90 days or more past due. Past due loan amounts at December 31, 2013 include government insured or guaranteed Other consumer loans totaling
$154 million for 30 to 59 days past due, $94 million for 60 to 89 days past due and $339 million for 90 days or more past due.
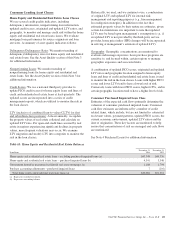
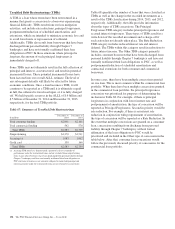
In the normal course of business, we originate or purchase loan products with contractual characteristics that, when concentrated,
may increase our exposure as a holder of those loan products. Possible product features that may create a concentration of credit
risk would include a high original or updated LTV ratio, terms that may expose the borrower to future increases in repayments
above increases in market interest rates, and interest-only loans, among others. We also originate home equity and residential real
estate loans that are concentrated in our primary geographic markets.
We originate interest-only loans to commercial borrowers. Such credit arrangements are usually designed to match borrower cash
flow expectations (e.g., working capital lines, revolvers). These products are standard in the financial services industry and product
features are considered during the underwriting process to mitigate the increased risk that the interest-only feature may result in
borrowers not being able to make interest and principal payments when due. We do not believe that these product features create a
concentration of credit risk.
At December 31, 2014, we pledged $19.2 billion of commercial loans to the Federal Reserve Bank (FRB) and $52.8 billion of
residential real estate and other loans to the Federal Home Loan Bank (FHLB) as collateral for the contingent ability to borrow, if
necessary. The comparable amounts at December 31, 2013 were $23.4 billion and $40.4 billion, respectively.
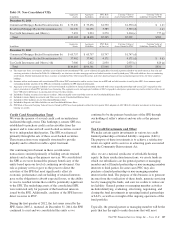
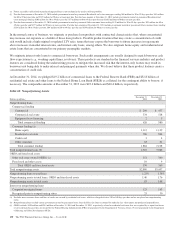
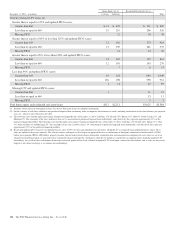
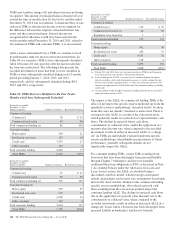
Table 61: Nonperforming Assets
Dollars in millions
December 31
2014
December 31
2013
Nonperforming loans
Commercial lending
Commercial $ 290 $ 457
Commercial real estate 334 518
Equipment lease financing 25
Total commercial lending 626 980
Consumer lending (a)
Home equity 1,112 1,139
Residential real estate 706 904
Credit card 34
Other consumer 63 61
Total consumer lending 1,884 2,108
Total nonperforming loans (b) 2,510 3,088
OREO and foreclosed assets
Other real estate owned (OREO) (c) 351 360
Foreclosed and other assets 19 9
Total OREO and foreclosed assets 370 369
Total nonperforming assets $2,880 $3,457
Nonperforming loans to total loans 1.23% 1.58%
Nonperforming assets to total loans, OREO and foreclosed assets 1.40 1.76
Nonperforming assets to total assets .83 1.08
Interest on nonperforming loans
Computed on original terms 125 163
Recognized prior to nonperforming status 25 30
(a) Excludes most consumer loans and lines of credit, not secured by residential real estate, which are charged off after 120 to 180 days past due and are not placed on nonperforming
status.
(b) Nonperforming loans exclude certain government insured or guaranteed loans, loans held for sale, loans accounted for under the fair value option and purchased impaired loans.
(c) OREO excludes $194 million and $245 million at December 31, 2014 and December 31, 2013, respectively, related to residential real estate that was acquired by us upon foreclosure
of serviced loans because they are insured by the Federal Housing Administration (FHA) or guaranteed by the Department of Veterans Affairs (VA) or guaranteed by the Department
of Housing and Urban Development (HUD).
130 The PNC Financial Services Group, Inc. – Form 10-K