PNC Bank 2014 Annual Report Download - page 240
Download and view the complete annual report
Please find page 240 of the 2014 PNC Bank annual report below. You can navigate through the pages in the report by either clicking on the pages listed below, or by using the keyword search tool below to find specific information within the annual report.-
 1
1 -
2
-
3
-
4
-
5
-
6
-
7
-
8
-
9
-
10
-
11
-
12
-
13
-
14
-
15
-
16
-
17
-
18
-
19
-
20
-
21
-
22
-
23
-
24
-
25
-
26
-
27
-
28
-
29
-
30
-
31
-
32
-
33
-
34
-
35
-
36
-
37
-
38
-
39
-
40
-
41
-
42
-
43
-
44
-
45
-
46
-
47
-
48
-
49
-
50
-
51
-
52
-
53
-
54
-
55
-
56
-
57
-
58
-
59
-
60
-
61
-
62
-
63
-
64
-
65
-
66
-
67
-
68
-
69
-
70
-
71
-
72
-
73
-
74
-
75
-
76
-
77
-
78
-
79
-
80
-
81
-
82
-
83
-
84
-
85
-
86
-
87
-
88
-
89
-
90
-
91
-
92
-
93
-
94
-
95
-
96
-
97
-
98
-
99
-
100
-
101
-
102
-
103
-
104
-
105
-
106
-
107
-
108
-
109
-
110
-
111
-
112
-
113
-
114
-
115
-
116
-
117
-
118
-
119
-
120
-
121
-
122
-
123
-
124
-
125
-
126
-
127
-
128
-
129
-
130
-
131
-
132
-
133
-
134
-
135
-
136
-
137
-
138
-
139
-
140
-
141
-
142
-
143
-
144
-
145
-
146
-
147
-
148
-
149
-
150
-
151
-
152
-
153
-
154
-
155
-
156
-
157
-
158
-
159
-
160
-
161
-
162
-
163
-
164
-
165
-
166
-
167
-
168
-
169
-
170
-
171
-
172
-
173
-
174
-
175
-
176
-
177
-
178
-
179
-
180
-
181
-
182
-
183
-
184
-
185
-
186
-
187
-
188
-
189
-
190
-
191
-
192
-
193
-
194
-
195
-
196
-
197
-
198
-
199
-
200
-
201
-
202
-
203
-
204
-
205
-
206
-
207
-
208
-
209
-
210
-
211
-
212
-
213
-
214
-
215
-
216
-
217
-
218
-
219
-
220
-
221
-
222
-
223
-
224
-
225
-
226
-
227
-
228
-
229
-
 230
230 -
 231
231 -
 232
232 -
 233
233 -
 234
234 -
 235
235 -
 236
236 -
 237
237 -
 238
238 -
 239
239 -
 240
240 -
 241
241 -
 242
242 -
 243
243 -
 244
244 -
 245
245 -
 246
246 -
 247
247 -
 248
248 -
 249
249 -
 250
250 -
251
-
252
-
253
-
254
-
255
-
256
-
257
-
258
-
259
-
260
-
261
-
262
-
263
-
264
-
265
-
266
-
267
-
268
 |
 |

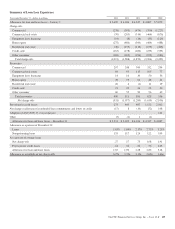
STATISTICAL INFORMATION (UNAUDITED)
THE PNC FINANCIAL SERVICES GROUP, INC.
Selected Quarterly Financial Data
Dollars in millions,
except per share data
2014 2013
Fourth Third Second First Fourth Third Second First
Summary Of Operations
Interest income $2,337 $2,328 $2,356 $2,410 $2,479 $2,448 $2,469 $2,611
Interest expense 240 224 227 215 213 214 211 222
Net interest income 2,097 2,104 2,129 2,195 2,266 2,234 2,258 2,389
Noninterest income (a) 1,850 1,737 1,681 1,582 1,807 1,686 1,806 1,566
Total revenue 3,947 3,841 3,810 3,777 4,073 3,920 4,064 3,955
Provision for credit losses 52 55 72 94 113 137 157 236
Noninterest expense (b) 2,539 2,357 2,328 2,264 2,514 2,394 2,405 2,368
Income before income taxes and noncontrolling interests 1,356 1,429 1,410 1,419 1,446 1,389 1,502 1,351
Income taxes (b) 299 391 358 359 372 361 387 356
Net income (b) 1,057 1,038 1,052 1,060 1,074 1,028 1,115 995
Less: Net income (loss) attributable to noncontrolling interests (b) 21 1 3 (2) 13 2 4 (8)
Preferred stock dividends and discount accretion and
redemptions 48 71 48 70 50 71 53 75
Net income attributable to common shareholders $ 988 $ 966 $1,001 $ 992 $1,011 $ 955 $1,058 $ 928
Per Common Share Data
Book value (b) $77.61 $76.71 $75.62 $73.73 $72.07 $69.75 $68.32 $68.10
Basic earnings from net income (b) (c) 1.88 1.82 1.88 1.86 1.90 1.80 2.00 1.76
Diluted earnings from net income (b) (c) 1.84 1.79 1.85 1.82 1.87 1.77 1.98 1.74
(a) Noninterest income included private equity gains/(losses) and net gains on sales of securities in each quarter as follows:
2014 2013
in millions Fourth Third Second First Fourth Third Second First
Private equity gains/(losses) $61 $70 $35 $42 $99 $43 $33 $27
Net gains on sales of securities – – (6) 10 3 21 61 14
(b) Amounts for 2013 periods have been updated to reflect the first quarter 2014 adoption of Accounting Standards Update (ASU) 2014-01 related to investments in low income housing
tax credits.
(c) The sum of the quarterly amounts for 2014 and 2013 does not equal the respective year’s amount because the quarterly calculations are based on a changing number of average shares.
222 The PNC Financial Services Group, Inc. – Form 10-K