PNC Bank 2014 Annual Report Download - page 218
Download and view the complete annual report
Please find page 218 of the 2014 PNC Bank annual report below. You can navigate through the pages in the report by either clicking on the pages listed below, or by using the keyword search tool below to find specific information within the annual report.-
 1
1 -
2
-
3
-
4
-
5
-
6
-
7
-
8
-
9
-
10
-
11
-
12
-
13
-
14
-
15
-
16
-
17
-
18
-
19
-
20
-
21
-
22
-
23
-
24
-
25
-
26
-
27
-
28
-
29
-
30
-
31
-
32
-
33
-
34
-
35
-
36
-
37
-
38
-
39
-
40
-
41
-
42
-
43
-
44
-
45
-
46
-
47
-
48
-
49
-
50
-
51
-
52
-
53
-
54
-
55
-
56
-
57
-
58
-
59
-
60
-
61
-
62
-
63
-
64
-
65
-
66
-
67
-
68
-
69
-
70
-
71
-
72
-
73
-
74
-
75
-
76
-
77
-
78
-
79
-
80
-
81
-
82
-
83
-
84
-
85
-
86
-
87
-
88
-
89
-
90
-
91
-
92
-
93
-
94
-
95
-
96
-
97
-
98
-
99
-
100
-
101
-
102
-
103
-
104
-
105
-
106
-
107
-
108
-
109
-
110
-
111
-
112
-
113
-
114
-
115
-
116
-
117
-
118
-
119
-
120
-
121
-
122
-
123
-
124
-
125
-
126
-
127
-
128
-
129
-
130
-
131
-
132
-
133
-
134
-
135
-
136
-
137
-
138
-
139
-
140
-
141
-
142
-
143
-
144
-
145
-
146
-
147
-
148
-
149
-
150
-
151
-
152
-
153
-
154
-
155
-
156
-
157
-
158
-
159
-
160
-
161
-
162
-
163
-
164
-
165
-
166
-
167
-
168
-
169
-
170
-
171
-
172
-
173
-
174
-
175
-
176
-
177
-
178
-
179
-
180
-
181
-
182
-
183
-
184
-
185
-
186
-
187
-
188
-
189
-
190
-
191
-
192
-
193
-
194
-
195
-
196
-
197
-
198
-
199
-
200
-
201
-
202
-
203
-
204
-
205
-
206
-
207
-
 208
208 -
 209
209 -
 210
210 -
 211
211 -
 212
212 -
 213
213 -
 214
214 -
 215
215 -
 216
216 -
 217
217 -
 218
218 -
 219
219 -
 220
220 -
 221
221 -
 222
222 -
 223
223 -
 224
224 -
 225
225 -
 226
226 -
 227
227 -
 228
228 -
229
-
230
-
231
-
232
-
233
-
234
-
235
-
236
-
237
-
238
-
239
-
240
-
241
-
242
-
243
-
244
-
245
-
246
-
247
-
248
-
249
-
250
-
251
-
252
-
253
-
254
-
255
-
256
-
257
-
258
-
259
-
260
-
261
-
262
-
263
-
264
-
265
-
266
-
267
-
268
 |
 |

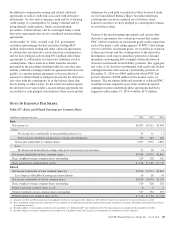
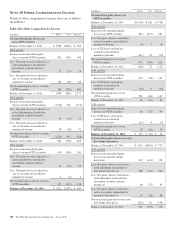
The accumulated balances related to each component of other
comprehensive income (loss) are as follows:
Table 141: Accumulated Other Comprehensive Income
(Loss) Components
2014 2013
At December 31 – In millions Pretax After-tax Pretax After-tax
Net unrealized gains (losses)
on non-OTTI securities $1,022 $ 647 $ 647 $ 409
Net unrealized gains (losses)
on OTTI securities 115 74 36 24
Net unrealized gains (losses)
on cash flow hedge
derivatives 552 350 384 243
Pension and other
postretirement benefit
plan adjustments (820) (520) (374) (237)
Other (59) (48) (20) (3)
Accumulated other
comprehensive income
(loss) $ 810 $ 503 $ 673 $ 436
N
OTE
19 I
NCOME
T
AXES
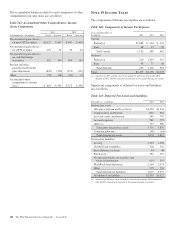
The components of Income tax expense are as follows:
Table 142: Components of Income Tax Expense
Year ended December 31
In millions 2014 2013 2012
Current
Federal (a) $1,084 $ 263 $ 453
State 68 17 29
Total current 1,152 280 482
Deferred
Federal (a) 220 1,119 515
State 35 77 48
Total deferred 255 1,196 563
Total $1,407 $1,476 $1,045
(a) Amounts for 2013 and 2012 have been updated to reflect the first quarter 2014
adoption of ASU 2014-01 related to investments in low income housing tax credits.
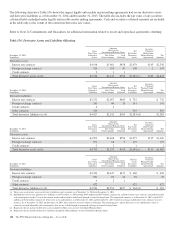
Significant components of deferred tax assets and liabilities
are as follows:
Table 143: Deferred Tax Assets and Liabilities
December 31 – in millions 2014 2013
Deferred tax assets
Allowance for loan and lease losses $1,250 $1,343
Compensation and benefits 822 581
Loss and credit carryforward 545 797
Accrued expenses 581 575
Other (a) 537 580
Total gross deferred tax assets 3,735 3,876
Valuation allowance (65) (61)
Total deferred tax assets 3,670 3,815
Deferred tax liabilities
Leasing 1,494 1,498
Goodwill and intangibles 328 342
Basis difference in loans 44 48
Fixed assets 381 397
Net unrealized gains on securities and
financial instruments 619 391
BlackRock basis difference 2,166 2,031
Other 575 730
Total deferred tax liabilities 5,607 5,437
Net deferred tax liability $1,937 $1,622
(a) Amounts for 2013 have been updated to reflect the first quarter 2014 adoption of
ASU 2014-01 related to investments in low income housing tax credits.
200 The PNC Financial Services Group, Inc. – Form 10-K