PNC Bank 2014 Annual Report Download - page 199
Download and view the complete annual report
Please find page 199 of the 2014 PNC Bank annual report below. You can navigate through the pages in the report by either clicking on the pages listed below, or by using the keyword search tool below to find specific information within the annual report.-
 1
1 -
2
-
3
-
4
-
5
-
6
-
7
-
8
-
9
-
10
-
11
-
12
-
13
-
14
-
15
-
16
-
17
-
18
-
19
-
20
-
21
-
22
-
23
-
24
-
25
-
26
-
27
-
28
-
29
-
30
-
31
-
32
-
33
-
34
-
35
-
36
-
37
-
38
-
39
-
40
-
41
-
42
-
43
-
44
-
45
-
46
-
47
-
48
-
49
-
50
-
51
-
52
-
53
-
54
-
55
-
56
-
57
-
58
-
59
-
60
-
61
-
62
-
63
-
64
-
65
-
66
-
67
-
68
-
69
-
70
-
71
-
72
-
73
-
74
-
75
-
76
-
77
-
78
-
79
-
80
-
81
-
82
-
83
-
84
-
85
-
86
-
87
-
88
-
89
-
90
-
91
-
92
-
93
-
94
-
95
-
96
-
97
-
98
-
99
-
100
-
101
-
102
-
103
-
104
-
105
-
106
-
107
-
108
-
109
-
110
-
111
-
112
-
113
-
114
-
115
-
116
-
117
-
118
-
119
-
120
-
121
-
122
-
123
-
124
-
125
-
126
-
127
-
128
-
129
-
130
-
131
-
132
-
133
-
134
-
135
-
136
-
137
-
138
-
139
-
140
-
141
-
142
-
143
-
144
-
145
-
146
-
147
-
148
-
149
-
150
-
151
-
152
-
153
-
154
-
155
-
156
-
157
-
158
-
159
-
160
-
161
-
162
-
163
-
164
-
165
-
166
-
167
-
168
-
169
-
170
-
171
-
172
-
173
-
174
-
175
-
176
-
177
-
178
-
179
-
180
-
181
-
182
-
183
-
184
-
185
-
186
-
187
-
188
-
 189
189 -
 190
190 -
 191
191 -
 192
192 -
 193
193 -
 194
194 -
 195
195 -
 196
196 -
 197
197 -
 198
198 -
 199
199 -
 200
200 -
 201
201 -
 202
202 -
 203
203 -
 204
204 -
 205
205 -
 206
206 -
 207
207 -
 208
208 -
 209
209 -
210
-
211
-
212
-
213
-
214
-
215
-
216
-
217
-
218
-
219
-
220
-
221
-
222
-
223
-
224
-
225
-
226
-
227
-
228
-
229
-
230
-
231
-
232
-
233
-
234
-
235
-
236
-
237
-
238
-
239
-
240
-
241
-
242
-
243
-
244
-
245
-
246
-
247
-
248
-
249
-
250
-
251
-
252
-
253
-
254
-
255
-
256
-
257
-
258
-
259
-
260
-
261
-
262
-
263
-
264
-
265
-
266
-
267
-
268
 |
 |

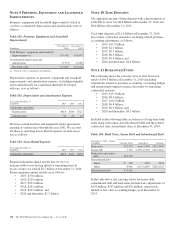
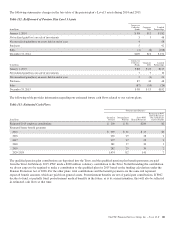
The following summarizes changes in the fair value of the pension plan’s Level 3 assets during 2014 and 2013.
Table 112: Rollforward of Pension Plan Level 3 Assets
In millions
Interest in
Collective
Funds
Corporate
Debt
Limited
Partnerships
January 1, 2014 $ 98 $13 $ 182
Net realized gain/(loss) on sale of investments 3 3 48
Net unrealized gain/(loss) on assets held at end of year 4 58
Purchases 592
Sales (1) (6) (108)
December 31, 2014 $109 $10 $ 272
In millions
Interest in
Collective
Funds
Corporate
Debt
Limited
Partnerships
January 1, 2013 $ 88 $ 22 $127
Net realized gain/(loss) on sale of investments 7 7 10
Net unrealized gain/(loss) on assets held at end of year 3 (1) 21
Purchases 87 40 48
Sales (87) (55) (24)
December 31, 2013 $ 98 $ 13 $182
The following table provides information regarding our estimated future cash flows related to our various plans.
Table 113: Estimated Cash Flows
Postretirement Benefits
In millions
Qualified
Pension
Nonqualified
Pension
Gross PNC
Benefit Payments
Reduction in PNC
Benefit Payments
Due to Medicare
Part D Subsidy
Estimated 2015 employer contributions $ 200 $ 31 $200 $2
Estimated future benefit payments
2015 $ 259 $ 31 $ 27 $2
2016 265 29 28 2
2017 277 27 29 2
2018 281 27 30 2
2019 282 25 30 2
2020-2024 1,474 112 141 7
The qualified pension plan contributions are deposited into the Trust, and the qualified pension plan benefit payments are paid
from the Trust. In February 2015, PNC made a $200 million voluntary contribution to the Trust. Notwithstanding the contribution,
we do not expect to be required to make a contribution to the qualified plan for 2015 based on the funding calculations under the
Pension Protection Act of 2006. For the other plans, total contributions and the benefit payments are the same and represent
expected benefit amounts, which are paid from general assets. Postretirement benefits are net of participant contributions. If PNC
decides to fund, or partially fund, postretirement medical benefits in the future, as is its current intention, this will also be reflected
in estimated cash flows at that time.
The PNC Financial Services Group, Inc. – Form 10-K 181