PNC Bank 2014 Annual Report Download - page 192
Download and view the complete annual report
Please find page 192 of the 2014 PNC Bank annual report below. You can navigate through the pages in the report by either clicking on the pages listed below, or by using the keyword search tool below to find specific information within the annual report.-
 1
1 -
2
-
3
-
4
-
5
-
6
-
7
-
8
-
9
-
10
-
11
-
12
-
13
-
14
-
15
-
16
-
17
-
18
-
19
-
20
-
21
-
22
-
23
-
24
-
25
-
26
-
27
-
28
-
29
-
30
-
31
-
32
-
33
-
34
-
35
-
36
-
37
-
38
-
39
-
40
-
41
-
42
-
43
-
44
-
45
-
46
-
47
-
48
-
49
-
50
-
51
-
52
-
53
-
54
-
55
-
56
-
57
-
58
-
59
-
60
-
61
-
62
-
63
-
64
-
65
-
66
-
67
-
68
-
69
-
70
-
71
-
72
-
73
-
74
-
75
-
76
-
77
-
78
-
79
-
80
-
81
-
82
-
83
-
84
-
85
-
86
-
87
-
88
-
89
-
90
-
91
-
92
-
93
-
94
-
95
-
96
-
97
-
98
-
99
-
100
-
101
-
102
-
103
-
104
-
105
-
106
-
107
-
108
-
109
-
110
-
111
-
112
-
113
-
114
-
115
-
116
-
117
-
118
-
119
-
120
-
121
-
122
-
123
-
124
-
125
-
126
-
127
-
128
-
129
-
130
-
131
-
132
-
133
-
134
-
135
-
136
-
137
-
138
-
139
-
140
-
141
-
142
-
143
-
144
-
145
-
146
-
147
-
148
-
149
-
150
-
151
-
152
-
153
-
154
-
155
-
156
-
157
-
158
-
159
-
160
-
161
-
162
-
163
-
164
-
165
-
166
-
167
-
168
-
169
-
170
-
171
-
172
-
173
-
174
-
175
-
176
-
177
-
178
-
179
-
180
-
181
-
 182
182 -
 183
183 -
 184
184 -
 185
185 -
 186
186 -
 187
187 -
 188
188 -
 189
189 -
 190
190 -
 191
191 -
 192
192 -
 193
193 -
 194
194 -
 195
195 -
 196
196 -
 197
197 -
 198
198 -
 199
199 -
 200
200 -
 201
201 -
 202
202 -
203
-
204
-
205
-
206
-
207
-
208
-
209
-
210
-
211
-
212
-
213
-
214
-
215
-
216
-
217
-
218
-
219
-
220
-
221
-
222
-
223
-
224
-
225
-
226
-
227
-
228
-
229
-
230
-
231
-
232
-
233
-
234
-
235
-
236
-
237
-
238
-
239
-
240
-
241
-
242
-
243
-
244
-
245
-
246
-
247
-
248
-
249
-
250
-
251
-
252
-
253
-
254
-
255
-
256
-
257
-
258
-
259
-
260
-
261
-
262
-
263
-
264
-
265
-
266
-
267
-
268
 |
 |

N
OTE
9P
REMISES
,E
QUIPMENT AND
L
EASEHOLD
I
MPROVEMENTS
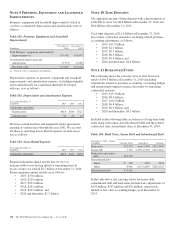
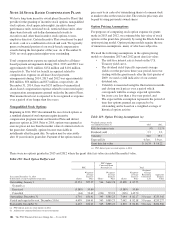
Premises, equipment and leasehold improvements, stated at
cost less accumulated depreciation and amortization, were as
follows:
Table 101: Premises, Equipment and Leasehold
Improvements
In millions
December 31
2014
December 31
2013
Total Premises, equipment and leasehold
improvements (a) $ 9,416 $ 8,903
Accumulated depreciation and
amortization (3,773) (3,285)
Net book value $ 5,643 $ 5,618
(a) Primarily relates to equipment and buildings.
Depreciation expense on premises, equipment and leasehold
improvements and amortization expense, excluding intangible
assets and primarily for capitalized internally developed
software, was as follows:
Table 102: Depreciation and Amortization Expense
Year ended December 31
In millions 2014 2013 2012
Continuing operations:
Depreciation $618 $546 $521
Amortization 30 23 19
We lease certain facilities and equipment under agreements
expiring at various dates through the year 2081. We account
for these as operating leases. Rental expense on such leases
was as follows:
Table 103: Lease Rental Expense
Year ended December 31
In millions 2014 2013 2012
Continuing operations: $414 $412 $405
Required minimum annual rentals that we owe on
noncancelable leases having initial or remaining terms in
excess of one year totaled $2.7 billion at December 31, 2014.
Future minimum annual rentals are as follows:
• 2015: $376 million,
• 2016: $329 million,
• 2017: $293 million,
• 2018: $261 million,
• 2019: $217 million, and
• 2020 and thereafter: $1.2 billion.
N
OTE
10 T
IME
D
EPOSITS
The aggregate amount of time deposits with a denomination of
$100,000 or more was $8.8 billion at December 31, 2014 and
$9.0 billion at December 31, 2013.
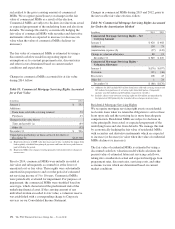
Total time deposits of $21.4 billion at December 31, 2014
have future contractual maturities, including related purchase
accounting adjustments, as follows:
• 2015: $15.2 billion,
• 2016: $2.2 billion,
• 2017: $0.5 billion,
• 2018: $0.3 billion,
• 2019: $0.4 billion, and
• 2020 and thereafter: $2.8 billion.
N
OTE
11 B
ORROWED
F
UNDS
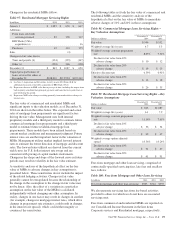
The following shows the carrying value of total borrowed
funds of $56.8 billion at December 31, 2014 (including
adjustments related to purchase accounting, accounting hedges
and unamortized original issuance discounts) by remaining
contractual maturity:
• 2015: $15.3 billion,
• 2016: $8.4 billion,
• 2017: $10.7 billion,
• 2018: $6.4 billion,
• 2019: $6.9 billion, and
• 2020 and thereafter: $9.1 billion.
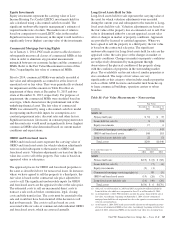
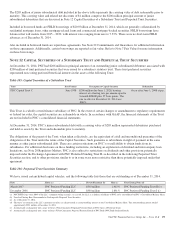
Included in the following table are balances of long-term bank
notes along with senior and subordinated debt and the related
contractual rates and maturity dates at December 31, 2014.
Table 104: Bank Notes, Senior Debt and Subordinated Debt
December 31, 2014 – Dollars
in millions Carrying Value Stated Rate Maturity
Bank notes $ 8,574 zero-3.30% 2015-2043
Senior debt 7,176 2.70%-6.70% 2015-2022
Bank notes and senior
debt $15,750
Subordinated debt
Junior $ 205 .81% 2028
Other 8,946 .61%-6.88% 2015-2025
Subordinated debt $ 9,151
In the table above, the carrying values for senior debt,
subordinated debt and bank notes include basis adjustments of
$193 million, $317 million and $20 million, respectively,
related to fair value accounting hedges as of December 31,
2014.
174 The PNC Financial Services Group, Inc. – Form 10-K