PNC Bank 2014 Annual Report Download - page 154
Download and view the complete annual report
Please find page 154 of the 2014 PNC Bank annual report below. You can navigate through the pages in the report by either clicking on the pages listed below, or by using the keyword search tool below to find specific information within the annual report.-
 1
1 -
2
-
3
-
4
-
5
-
6
-
7
-
8
-
9
-
10
-
11
-
12
-
13
-
14
-
15
-
16
-
17
-
18
-
19
-
20
-
21
-
22
-
23
-
24
-
25
-
26
-
27
-
28
-
29
-
30
-
31
-
32
-
33
-
34
-
35
-
36
-
37
-
38
-
39
-
40
-
41
-
42
-
43
-
44
-
45
-
46
-
47
-
48
-
49
-
50
-
51
-
52
-
53
-
54
-
55
-
56
-
57
-
58
-
59
-
60
-
61
-
62
-
63
-
64
-
65
-
66
-
67
-
68
-
69
-
70
-
71
-
72
-
73
-
74
-
75
-
76
-
77
-
78
-
79
-
80
-
81
-
82
-
83
-
84
-
85
-
86
-
87
-
88
-
89
-
90
-
91
-
92
-
93
-
94
-
95
-
96
-
97
-
98
-
99
-
100
-
101
-
102
-
103
-
104
-
105
-
106
-
107
-
108
-
109
-
110
-
111
-
112
-
113
-
114
-
115
-
116
-
117
-
118
-
119
-
120
-
121
-
122
-
123
-
124
-
125
-
126
-
127
-
128
-
129
-
130
-
131
-
132
-
133
-
134
-
135
-
136
-
137
-
138
-
139
-
140
-
141
-
142
-
143
-
 144
144 -
 145
145 -
 146
146 -
 147
147 -
 148
148 -
 149
149 -
 150
150 -
 151
151 -
 152
152 -
 153
153 -
 154
154 -
 155
155 -
 156
156 -
 157
157 -
 158
158 -
 159
159 -
 160
160 -
 161
161 -
 162
162 -
 163
163 -
 164
164 -
165
-
166
-
167
-
168
-
169
-
170
-
171
-
172
-
173
-
174
-
175
-
176
-
177
-
178
-
179
-
180
-
181
-
182
-
183
-
184
-
185
-
186
-
187
-
188
-
189
-
190
-
191
-
192
-
193
-
194
-
195
-
196
-
197
-
198
-
199
-
200
-
201
-
202
-
203
-
204
-
205
-
206
-
207
-
208
-
209
-
210
-
211
-
212
-
213
-
214
-
215
-
216
-
217
-
218
-
219
-
220
-
221
-
222
-
223
-
224
-
225
-
226
-
227
-
228
-
229
-
230
-
231
-
232
-
233
-
234
-
235
-
236
-
237
-
238
-
239
-
240
-
241
-
242
-
243
-
244
-
245
-
246
-
247
-
248
-
249
-
250
-
251
-
252
-
253
-
254
-
255
-
256
-
257
-
258
-
259
-
260
-
261
-
262
-
263
-
264
-
265
-
266
-
267
-
268
 |
 |

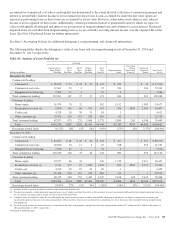
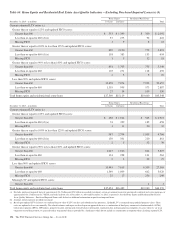
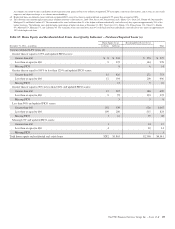
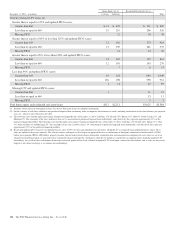
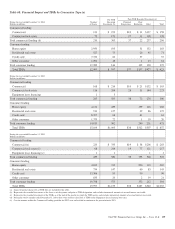
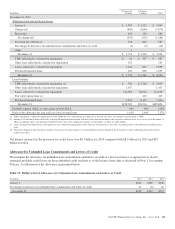
Home Equity (b) (c) Residential Real Estate (b) (c)
TotalDecember 31, 2013 – in millions 1st Liens 2nd Liens
Current estimated LTV ratios (d)
Greater than or equal to 125% and updated FICO scores:
Greater than 660 $ 13 $ 435 $ 361 $ 809
Less than or equal to 660 15 215 296 526
Missing FICO 12 24 36
Greater than or equal to 100% to less than 125% and updated FICO scores:
Greater than 660 21 516 373 910
Less than or equal to 660 15 239 281 535
Missing FICO 14 14 28
Greater than or equal to 90% to less than 100% and updated FICO scores:
Greater than 660 15 202 197 414
Less than or equal to 660 12 101 163 276
Missing FICO 7613
Less than 90% and updated FICO scores:
Greater than 660 93 261 646 1,000
Less than or equal to 660 126 198 590 914
Missing FICO 1 11 47 59
Missing LTV and updated FICO scores:
Greater than 660 1 11 12
Less than or equal to 660 13 13
Missing FICO 33
Total home equity and residential real estate loans $312 $2,211 $3,025 $5,548
(a) Amounts shown represent outstanding balance. See Note 4 Purchased Loans for additional information.
(b) For the estimate of cash flows utilized in our purchased impaired loan accounting, other assumptions and estimates are made, including amortization of first lien balances, pre-payment
rates, etc., which are not reflected in this table.
(c) The following states had the highest percentage of purchased impaired loans at December 31, 2014: California 17%, Florida 15%, Illinois 11%, Ohio 8%, North Carolina 7%, and
Michigan 5%. The remainder of the states had lower than a 4% concentration of purchased impaired loans individually, and collectively they represent approximately 37% of the
purchased impaired portfolio. The following states had the highest percentage of purchased impaired loans at December 31, 2013: California 17%, Florida 16%, Illinois 11%, Ohio
8%, North Carolina 8% and Michigan 5%. The remainder of the states had lower than a 4% concentration of purchased impaired loans individually, and collectively they represent
approximately 35% of the purchased impaired portfolio.
(d) Based upon updated LTV (inclusive of combined loan-to-value (CLTV) for first and subordinate lien positions). Updated LTV is estimated using modeled property values. These
ratios are updated at least semi-annually. The related estimates and inputs are based upon an approach that uses a combination of third-party automated valuation models (AVMs),
broker price opinions (BPOs), HPI indices, property location, internal and external balance information, origination data and management assumptions. In cases where we are in an
originated second lien position, we generally utilize origination balances provided by a third-party which do not include an amortization assumption when calculating updated LTV.
Accordingly, the results of these calculations do not represent actual appraised loan level collateral or updated LTV based upon a current first lien balance, and as such, are necessarily
imprecise and subject to change as we enhance our methodology.
136 The PNC Financial Services Group, Inc. – Form 10-K