PNC Bank 2014 Annual Report Download - page 185
Download and view the complete annual report
Please find page 185 of the 2014 PNC Bank annual report below. You can navigate through the pages in the report by either clicking on the pages listed below, or by using the keyword search tool below to find specific information within the annual report.-
 1
1 -
2
-
3
-
4
-
5
-
6
-
7
-
8
-
9
-
10
-
11
-
12
-
13
-
14
-
15
-
16
-
17
-
18
-
19
-
20
-
21
-
22
-
23
-
24
-
25
-
26
-
27
-
28
-
29
-
30
-
31
-
32
-
33
-
34
-
35
-
36
-
37
-
38
-
39
-
40
-
41
-
42
-
43
-
44
-
45
-
46
-
47
-
48
-
49
-
50
-
51
-
52
-
53
-
54
-
55
-
56
-
57
-
58
-
59
-
60
-
61
-
62
-
63
-
64
-
65
-
66
-
67
-
68
-
69
-
70
-
71
-
72
-
73
-
74
-
75
-
76
-
77
-
78
-
79
-
80
-
81
-
82
-
83
-
84
-
85
-
86
-
87
-
88
-
89
-
90
-
91
-
92
-
93
-
94
-
95
-
96
-
97
-
98
-
99
-
100
-
101
-
102
-
103
-
104
-
105
-
106
-
107
-
108
-
109
-
110
-
111
-
112
-
113
-
114
-
115
-
116
-
117
-
118
-
119
-
120
-
121
-
122
-
123
-
124
-
125
-
126
-
127
-
128
-
129
-
130
-
131
-
132
-
133
-
134
-
135
-
136
-
137
-
138
-
139
-
140
-
141
-
142
-
143
-
144
-
145
-
146
-
147
-
148
-
149
-
150
-
151
-
152
-
153
-
154
-
155
-
156
-
157
-
158
-
159
-
160
-
161
-
162
-
163
-
164
-
165
-
166
-
167
-
168
-
169
-
170
-
171
-
172
-
173
-
174
-
 175
175 -
 176
176 -
 177
177 -
 178
178 -
 179
179 -
 180
180 -
 181
181 -
 182
182 -
 183
183 -
 184
184 -
 185
185 -
 186
186 -
 187
187 -
 188
188 -
 189
189 -
 190
190 -
 191
191 -
 192
192 -
 193
193 -
 194
194 -
 195
195 -
196
-
197
-
198
-
199
-
200
-
201
-
202
-
203
-
204
-
205
-
206
-
207
-
208
-
209
-
210
-
211
-
212
-
213
-
214
-
215
-
216
-
217
-
218
-
219
-
220
-
221
-
222
-
223
-
224
-
225
-
226
-
227
-
228
-
229
-
230
-
231
-
232
-
233
-
234
-
235
-
236
-
237
-
238
-
239
-
240
-
241
-
242
-
243
-
244
-
245
-
246
-
247
-
248
-
249
-
250
-
251
-
252
-
253
-
254
-
255
-
256
-
257
-
258
-
259
-
260
-
261
-
262
-
263
-
264
-
265
-
266
-
267
-
268
 |
 |

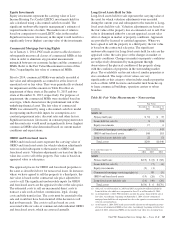
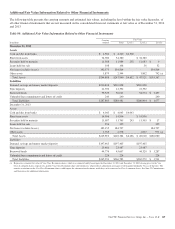
Financial Instruments Accounted For Under Fair Value
Option
We elect the fair value option to account for certain financial
instruments. For more information on these financial
instruments for which the fair value option election has been
made, please refer to the Fair Value Measurement section of
this Note 7. These financial instruments are initially measured
at fair value, gains and losses from initial measurement and
any changes in fair value are subsequently recognized in
earnings. Additional information about the financial
instruments for which we elected the fair value option follows.
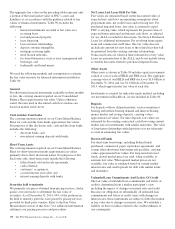
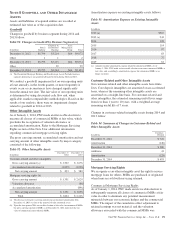
Customer Resale Agreements
Interest income on structured resale agreements is reported on
the Consolidated Income Statement in Other interest income.
Changes in fair value due to instrument-specific credit risk for
2014 and 2013 were not material.
Residential Mortgage-Backed Agency Securities with
Embedded Derivatives
Interest income on these securities is reported on the
Consolidated Income Statement in Other interest income.
Trading Loans
Interest income on trading loans is reported on the
Consolidated Income Statement in Other interest income.
Commercial Mortgage Loans Held for Sale
Interest income on these loans is recorded as earned and
reported on the Consolidated Income Statement in Other
interest income. The impact on earnings of offsetting
economic hedges is not reflected in these amounts. Changes in
fair value due to instrument-specific credit risk for both 2014
and 2013 were not material.
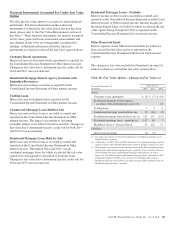
Residential Mortgage Loans Held for Sale
Interest income on these loans is recorded as earned and
reported on the Consolidated Income Statement in Other
interest income. Throughout 2014 and 2013, certain
residential mortgage loans for which we elected the fair value
option were subsequently reclassified to portfolio loans.
Changes in fair value due to instrument-specific credit risk for
2014 and 2013 were not material.
Residential Mortgage Loans – Portfolio
Interest income on these loans is recorded as earned and
reported on the Consolidated Income Statement in either Loan
interest income or Other interest income. Interest income on
the Home Equity Lines of Credit for which we elected the fair
value option during first quarter 2013 is reported on the
Consolidated Income Statement in Loan interest income.
Other Borrowed Funds
Interest expense on the Other borrowed funds for which we
have elected the fair value option is reported on the
Consolidated Income Statement in Borrowed funds interest
expense.
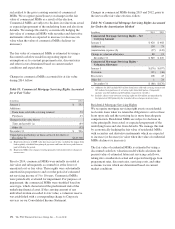
The changes in fair value included in Noninterest income for
items for which we elected the fair value option follow.
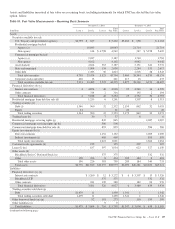
Table 88: Fair Value Option – Changes in Fair Value (a)
Year ended December 31
In millions
Gains (Losses)
2014 2013 2012
Assets
Customer resale agreements $ (3) $ (7) $ (10)
Residential mortgage-backed agency
securities with embedded derivatives (b) 13
Trading loans 2 3 2
Commercial mortgage loans held for sale 50 (10) (5)
Residential mortgage loans held for sale (c) 212 213 (223)
Residential mortgage loans – portfolio (c) 157 60 7
BlackRock Series C Preferred Stock 43 122 33
Liabilities
Other borrowed funds (5) (9)
(a) The impact on earnings of offsetting hedged items or hedging instruments is not
reflected in these amounts.
(b) At December 31, 2014, 2013 and 2012, the balance of residential mortgage-backed
agency securities with embedded derivatives carried in Trading securities was zero.
(c) Prior periods were corrected for the allocation between Residential mortgage loans
held for sale and Residential mortgage loans – portfolio. This resulted in a decrease
of $34 million from gains on Residential mortgage loans held for sale and an
increase of $33 million to gains on Residential mortgage loans – portfolio for 2013.
Comparable amounts for 2012 were a decrease of $43 million from gains on
Residential mortgage loans held for sale and an increase of $43 million to gains on
Residential mortgage loans – portfolio.
The PNC Financial Services Group, Inc. – Form 10-K 167