PNC Bank 2014 Annual Report Download - page 56
Download and view the complete annual report
Please find page 56 of the 2014 PNC Bank annual report below. You can navigate through the pages in the report by either clicking on the pages listed below, or by using the keyword search tool below to find specific information within the annual report.-
 1
1 -
2
-
3
-
4
-
5
-
6
-
7
-
8
-
9
-
10
-
11
-
12
-
13
-
14
-
15
-
16
-
17
-
18
-
19
-
20
-
21
-
22
-
23
-
24
-
25
-
26
-
27
-
28
-
29
-
30
-
31
-
32
-
33
-
34
-
35
-
36
-
37
-
38
-
39
-
40
-
41
-
42
-
43
-
44
-
45
-
 46
46 -
 47
47 -
 48
48 -
 49
49 -
 50
50 -
 51
51 -
 52
52 -
 53
53 -
 54
54 -
 55
55 -
 56
56 -
 57
57 -
 58
58 -
 59
59 -
 60
60 -
 61
61 -
 62
62 -
 63
63 -
 64
64 -
 65
65 -
 66
66 -
67
-
68
-
69
-
70
-
71
-
72
-
73
-
74
-
75
-
76
-
77
-
78
-
79
-
80
-
81
-
82
-
83
-
84
-
85
-
86
-
87
-
88
-
89
-
90
-
91
-
92
-
93
-
94
-
95
-
96
-
97
-
98
-
99
-
100
-
101
-
102
-
103
-
104
-
105
-
106
-
107
-
108
-
109
-
110
-
111
-
112
-
113
-
114
-
115
-
116
-
117
-
118
-
119
-
120
-
121
-
122
-
123
-
124
-
125
-
126
-
127
-
128
-
129
-
130
-
131
-
132
-
133
-
134
-
135
-
136
-
137
-
138
-
139
-
140
-
141
-
142
-
143
-
144
-
145
-
146
-
147
-
148
-
149
-
150
-
151
-
152
-
153
-
154
-
155
-
156
-
157
-
158
-
159
-
160
-
161
-
162
-
163
-
164
-
165
-
166
-
167
-
168
-
169
-
170
-
171
-
172
-
173
-
174
-
175
-
176
-
177
-
178
-
179
-
180
-
181
-
182
-
183
-
184
-
185
-
186
-
187
-
188
-
189
-
190
-
191
-
192
-
193
-
194
-
195
-
196
-
197
-
198
-
199
-
200
-
201
-
202
-
203
-
204
-
205
-
206
-
207
-
208
-
209
-
210
-
211
-
212
-
213
-
214
-
215
-
216
-
217
-
218
-
219
-
220
-
221
-
222
-
223
-
224
-
225
-
226
-
227
-
228
-
229
-
230
-
231
-
232
-
233
-
234
-
235
-
236
-
237
-
238
-
239
-
240
-
241
-
242
-
243
-
244
-
245
-
246
-
247
-
248
-
249
-
250
-
251
-
252
-
253
-
254
-
255
-
256
-
257
-
258
-
259
-
260
-
261
-
262
-
263
-
264
-
265
-
266
-
267
-
268
 |
 |

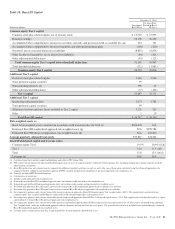
Residential mortgage revenue decreased to $618 million in
2014 from $871 million in 2013, primarily due to lower loan
sales revenue from a reduction in origination volume and
significantly lower net hedging gains on residential mortgage
servicing rights, partially offset by higher loan servicing fee
revenue and the impact of second quarter 2014 gains on sales
of previously underperforming portfolio loans.
Lower residential mortgage revenue in the comparison also
reflected the impact of the 2013 net benefit from release of
reserves for residential mortgage repurchase obligations of
$53 million, as the impact to 2014 was not significant. This
net release of reserves in 2013 was largely the result of
agreements with two government-sponsored enterprises
(GSEs), FHLMC and FNMA, for loans sold into agency
securitizations. See the Recourse And Repurchase Obligations
section of this Item 7 for further detail.
Service charges on deposits increased in 2014, benefitting
from changes in product offerings and higher customer-related
activity.
Other noninterest income decreased to $1.4 billion in 2014
compared to $1.5 billion in 2013. The decline was driven by a
reduction in asset valuations, lower revenue associated with
private equity investments, decreased revenue due to the lower
market value of investments related to deferred compensation
obligations, and lower revenue associated with customer-related
derivative activities, including credit valuations. These decreases
were partially offset by higher gains on sales of other assets.
The decline in revenue from credit valuations for customer-
related derivatives activities was driven primarily by market
interest rate changes impacting the valuations. The 2013
impact of these customer-related derivatives activities was $56
million, while the 2014 impact was not significant.
Higher gains on sales of other assets in the comparison
included $94 million on the fourth quarter 2014 sale of PNC’s
Washington, D.C. regional headquarters building, as well as
increased gains on sales of Visa Class B Common shares,
which were $209 million on sales of 3.5 million shares in
2014 compared to $168 million on the sale of 4 million shares
in 2013. As of December 31, 2014, we held approximately
7 million Visa Class B common shares with a fair value of
approximately $742 million and a recorded investment of
approximately $77 million.
Other noninterest income typically fluctuates from period to
period depending on the nature and magnitude of transactions
completed. Further details regarding our customer-related
trading activities are included in the Market Risk
Management – Customer-Related Trading Risk portion of the
Risk Management section of this Item 7. Further details
regarding private and other equity investments are included in
the Market Risk Management – Equity And Other Investment
Risk section, and further details regarding gains or losses
related to our equity investment in BlackRock are included in
the Business Segments Review section of this Item 7.
In the first quarter of 2015, we expect fee income to be down
mid-single digits, on a percentage basis, compared with the
fourth quarter of 2014 due to seasonality.
For full year 2015, we expect revenue to continue to be under
pressure compared with 2014, as we expect the combined
revenue growth from our businesses to partially offset the
decline in purchase accounting accretion.
Provision For Credit Losses
The provision for credit losses totaled $273 million in 2014
compared with $643 million in 2013. The decrease in
provision reflected improved overall credit quality, including
lower consumer loan delinquencies. A contributing economic
factor was the increasing value of residential real estate, which
improved expected cash flows from our purchased impaired
loans.
We currently expect our provision for credit losses in the first
quarter of 2015 to be between $50 million and $100 million.
The Credit Risk Management portion of the Risk Management
section of this Item 7 includes additional information
regarding factors impacting the provision for credit losses.
Noninterest Expense
Noninterest expense was $9.5 billion for 2014, a decrease of
$.2 billion, or 2%, from $9.7 billion for 2013, reflecting
overall disciplined expense management. The decline was
driven by a decrease in personnel expense related to lower
headcount and benefits costs, partially offset by investments in
technology and infrastructure. Additionally, noncash charges
of $57 million in 2013 for unamortized discounts related to
redemption of trust preferred securities contributed to the
decline. See Note 14 Capital Securities of Subsidiary Trusts
and Perpetual Trust Securities in Item 8 of our 2013
Form 10-K for additional detail on the 2013 redemption of
trust preferred securities.
During 2014, we completed actions and exceeded our 2014
continuous improvement goal of $500 million in cost savings.
These cost savings are funding investments in our
infrastructure, including those related to cybersecurity and our
datacenters, and investments in our diversified businesses,
including our Retail Banking transformation, consistent with
our strategic priorities.
In 2015, we expect to continue this approach and have a goal
of an additional $400 million in cost savings through our
Continuous Improvement Program, which again we expect
will help to fund our business and technology investments.
For the first quarter of 2015, we expect noninterest expense to
be down by high-single digits on a percentage basis compared
with the fourth quarter of 2014.
38 The PNC Financial Services Group, Inc. – Form 10-K