PNC Bank 2014 Annual Report Download - page 65
Download and view the complete annual report
Please find page 65 of the 2014 PNC Bank annual report below. You can navigate through the pages in the report by either clicking on the pages listed below, or by using the keyword search tool below to find specific information within the annual report.-
 1
1 -
2
-
3
-
4
-
5
-
6
-
7
-
8
-
9
-
10
-
11
-
12
-
13
-
14
-
15
-
16
-
17
-
18
-
19
-
20
-
21
-
22
-
23
-
24
-
25
-
26
-
27
-
28
-
29
-
30
-
31
-
32
-
33
-
34
-
35
-
36
-
37
-
38
-
39
-
40
-
41
-
42
-
43
-
44
-
45
-
46
-
47
-
48
-
49
-
50
-
51
-
52
-
53
-
54
-
 55
55 -
 56
56 -
 57
57 -
 58
58 -
 59
59 -
 60
60 -
 61
61 -
 62
62 -
 63
63 -
 64
64 -
 65
65 -
 66
66 -
 67
67 -
 68
68 -
 69
69 -
 70
70 -
 71
71 -
 72
72 -
 73
73 -
 74
74 -
 75
75 -
76
-
77
-
78
-
79
-
80
-
81
-
82
-
83
-
84
-
85
-
86
-
87
-
88
-
89
-
90
-
91
-
92
-
93
-
94
-
95
-
96
-
97
-
98
-
99
-
100
-
101
-
102
-
103
-
104
-
105
-
106
-
107
-
108
-
109
-
110
-
111
-
112
-
113
-
114
-
115
-
116
-
117
-
118
-
119
-
120
-
121
-
122
-
123
-
124
-
125
-
126
-
127
-
128
-
129
-
130
-
131
-
132
-
133
-
134
-
135
-
136
-
137
-
138
-
139
-
140
-
141
-
142
-
143
-
144
-
145
-
146
-
147
-
148
-
149
-
150
-
151
-
152
-
153
-
154
-
155
-
156
-
157
-
158
-
159
-
160
-
161
-
162
-
163
-
164
-
165
-
166
-
167
-
168
-
169
-
170
-
171
-
172
-
173
-
174
-
175
-
176
-
177
-
178
-
179
-
180
-
181
-
182
-
183
-
184
-
185
-
186
-
187
-
188
-
189
-
190
-
191
-
192
-
193
-
194
-
195
-
196
-
197
-
198
-
199
-
200
-
201
-
202
-
203
-
204
-
205
-
206
-
207
-
208
-
209
-
210
-
211
-
212
-
213
-
214
-
215
-
216
-
217
-
218
-
219
-
220
-
221
-
222
-
223
-
224
-
225
-
226
-
227
-
228
-
229
-
230
-
231
-
232
-
233
-
234
-
235
-
236
-
237
-
238
-
239
-
240
-
241
-
242
-
243
-
244
-
245
-
246
-
247
-
248
-
249
-
250
-
251
-
252
-
253
-
254
-
255
-
256
-
257
-
258
-
259
-
260
-
261
-
262
-
263
-
264
-
265
-
266
-
267
-
268
 |
 |

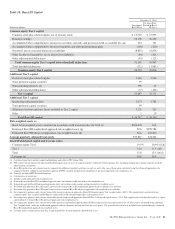
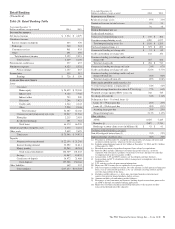
Table 18: Basel III Capital
December 31, 2014
Dollars in millions
Transitional
Basel III (a)
Pro forma Fully
Phased-In Basel
III (b)(c)
Common equity Tier 1 capital
Common stock plus related surplus, net of treasury stock $ 13,903 $ 13,903
Retained earnings 26,200 26,200
Accumulated other comprehensive income for securities currently and previously held as available for sale 144 721
Accumulated other comprehensive income for pension and other postretirement plans (104) (520)
Goodwill, net of associated deferred tax liabilities (8,855) (8,855)
Other disallowed intangibles, net of deferred tax liabilities (84) (421)
Other adjustments/(deductions) (63) (121)
Total common equity Tier 1 capital before threshold deductions 31,141 30,907
Total threshold deductions (212) (1,081)
Common equity Tier 1 capital 30,929 29,826
Additional Tier 1 capital
Preferred stock plus related surplus 3,946 3,946
Trust preferred capital securities 99
Noncontrolling interests (d) 790 43
Other adjustments/(deductions) (77) (104)
Tier 1 capital 35,687 33,711
Additional Tier 2 capital
Qualifying subordinated debt 5,473 4,764
Trust preferred capital securities 99
Allowance for loan and lease losses included in Tier 2 capital 3,521 215
Other 210
Total Basel III capital $ 44,782 $ 38,700
Risk-weighted assets (e)
Basel I risk-weighted assets calculated in accordance with transition rules for 2014 (f) $284,018 N/A
Estimated Basel III standardized approach risk-weighted assets (g) N/A $298,786
Estimated Basel III advanced approaches risk-weighted assets (h) N/A 285,870
Average quarterly adjusted total assets 329,827 328,562
Basel III risk-based capital and leverage ratios
Common equity Tier 1 10.9% 10.0% (i)(k)
Tier 1 12.6 11.3 (i)(l)
Total 15.8 13.5 (j)(m)
Leverage (n) 10.8 10.3
(a) Calculated using the regulatory capital methodology applicable to PNC during 2014.
(b) PNC utilizes the pro forma fully phased-in Basel III capital ratios to assess its capital position (without the benefit of phase-ins), including comparison to similar estimates made by
other financial institutions.
(c) Basel III capital ratios and estimates may be impacted by additional regulatory guidance or analysis and, in the case of those ratios calculated using the advanced approaches, the
ongoing evolution, validation and regulatory approval of PNC’s models integral to the calculation of advanced approaches risk-weighted assets.
(d) Primarily includes REIT Preferred Securities.
(e) Calculated as of period end.
(f) Includes credit and market risk-weighted assets.
(g) Estimated based on Basel III standardized approach rules and includes credit and market risk-weighted assets.
(h) Estimated based on Basel III advanced approaches rules and includes credit, market and operational risk-weighted assets.
(i) Pro forma fully phased-in Basel III capital ratio based on estimated Basel III standardized approach risk-weighted assets and rules.
(j) Pro forma fully phased-in Basel III capital ratio based on estimated Basel III advanced approaches risk-weighted assets and rules.
(k) For comparative purposes only, the pro forma fully phased-in advanced approaches Basel III Common equity Tier 1 capital ratio is 10.4%. This capital ratio is calculated using
Common equity Tier 1 capital and dividing by estimated Basel III advanced approaches risk-weighted assets.
(l) For comparative purposes only, the pro forma fully phased-in advanced approaches Basel III Tier 1 risk-based capital ratio is 11.8%. This capital ratio is calculated using Tier 1 capital
and dividing by estimated Basel III advanced approaches risk-weighted assets.
(m) For comparative purposes only, the pro forma fully phased-in standardized approach Basel III Total capital risk-based capital ratio is 14.1%. This ratio is calculated using additional
Tier 2 capital which, under the standardized approach, reflects allowance for loan and lease losses of up to 1.25% of credit risk related risk-weighted assets and dividing by estimated
Basel III standardized approach risk-weighted assets.
(n) Leverage ratio is calculated based on Tier 1 capital divided by Average quarterly adjusted total assets.
The PNC Financial Services Group, Inc. – Form 10-K 47