PNC Bank 2014 Annual Report Download - page 206
Download and view the complete annual report
Please find page 206 of the 2014 PNC Bank annual report below. You can navigate through the pages in the report by either clicking on the pages listed below, or by using the keyword search tool below to find specific information within the annual report.-
 1
1 -
2
-
3
-
4
-
5
-
6
-
7
-
8
-
9
-
10
-
11
-
12
-
13
-
14
-
15
-
16
-
17
-
18
-
19
-
20
-
21
-
22
-
23
-
24
-
25
-
26
-
27
-
28
-
29
-
30
-
31
-
32
-
33
-
34
-
35
-
36
-
37
-
38
-
39
-
40
-
41
-
42
-
43
-
44
-
45
-
46
-
47
-
48
-
49
-
50
-
51
-
52
-
53
-
54
-
55
-
56
-
57
-
58
-
59
-
60
-
61
-
62
-
63
-
64
-
65
-
66
-
67
-
68
-
69
-
70
-
71
-
72
-
73
-
74
-
75
-
76
-
77
-
78
-
79
-
80
-
81
-
82
-
83
-
84
-
85
-
86
-
87
-
88
-
89
-
90
-
91
-
92
-
93
-
94
-
95
-
96
-
97
-
98
-
99
-
100
-
101
-
102
-
103
-
104
-
105
-
106
-
107
-
108
-
109
-
110
-
111
-
112
-
113
-
114
-
115
-
116
-
117
-
118
-
119
-
120
-
121
-
122
-
123
-
124
-
125
-
126
-
127
-
128
-
129
-
130
-
131
-
132
-
133
-
134
-
135
-
136
-
137
-
138
-
139
-
140
-
141
-
142
-
143
-
144
-
145
-
146
-
147
-
148
-
149
-
150
-
151
-
152
-
153
-
154
-
155
-
156
-
157
-
158
-
159
-
160
-
161
-
162
-
163
-
164
-
165
-
166
-
167
-
168
-
169
-
170
-
171
-
172
-
173
-
174
-
175
-
176
-
177
-
178
-
179
-
180
-
181
-
182
-
183
-
184
-
185
-
186
-
187
-
188
-
189
-
190
-
191
-
192
-
193
-
194
-
195
-
 196
196 -
 197
197 -
 198
198 -
 199
199 -
 200
200 -
 201
201 -
 202
202 -
 203
203 -
 204
204 -
 205
205 -
 206
206 -
 207
207 -
 208
208 -
 209
209 -
 210
210 -
 211
211 -
 212
212 -
 213
213 -
 214
214 -
 215
215 -
 216
216 -
217
-
218
-
219
-
220
-
221
-
222
-
223
-
224
-
225
-
226
-
227
-
228
-
229
-
230
-
231
-
232
-
233
-
234
-
235
-
236
-
237
-
238
-
239
-
240
-
241
-
242
-
243
-
244
-
245
-
246
-
247
-
248
-
249
-
250
-
251
-
252
-
253
-
254
-
255
-
256
-
257
-
258
-
259
-
260
-
261
-
262
-
263
-
264
-
265
-
266
-
267
-
268
 |
 |

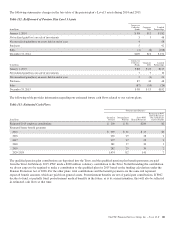
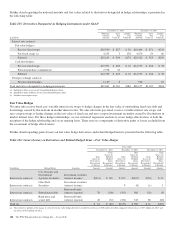
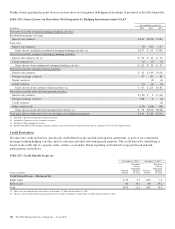
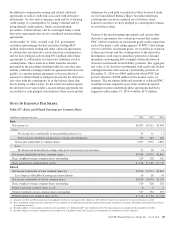
Further detail regarding the notional amounts and fair values related to derivatives designated in hedge relationships is presented in
the following table:
Table 125: Derivatives Designated As Hedging Instruments under GAAP
In millions
December 31, 2014 December 31, 2013
Notional/
Contract
Amount
Asset
Fair
Value (a)
Liability
Fair
Value (b)
Notional/
Contract
Amount
Asset
Fair
Value (a)
Liability
Fair
Value (b)
Interest rate contracts:
Fair value hedges:
Receive-fixed swaps $20,930 $ 827 $ 38 $16,446 $ 871 $230
Pay-fixed swaps (c) 4,233 3 138 4,076 54 66
Subtotal $25,163 $ 830 $176 $20,522 $ 925 $296
Cash flow hedges:
Receive-fixed swaps $19,991 $ 400 $ 10 $14,737 $ 264 $ 58
Forward purchase commitments 2,778 25
Subtotal $22,769 $ 425 $ 10 $14,737 $ 264 $ 58
Foreign exchange contracts:
Net investment hedges 1,129 6 938 10
Total derivatives designated as hedging instruments $49,061 $1,261 $186 $36,197 $1,189 $364
(a) Included in Other assets on our Consolidated Balance Sheet.
(b) Included in Other liabilities on our Consolidated Balance Sheet.
(c) Includes zero-coupon swaps.
Fair Value Hedges
We enter into receive-fixed, pay-variable interest rate swaps to hedge changes in the fair value of outstanding fixed-rate debt and
borrowings caused by fluctuations in market interest rates. We also enter into pay-fixed, receive-variable interest rate swaps and
zero-coupon swaps to hedge changes in the fair value of fixed rate and zero-coupon investment securities caused by fluctuations in
market interest rates. For these hedge relationships, we use statistical regression analysis to assess hedge effectiveness at both the
inception of the hedge relationship and on an ongoing basis. There were no components of derivative gains or losses excluded from
the assessment of hedge effectiveness.
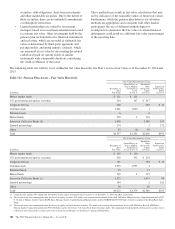
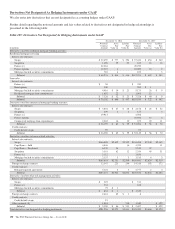
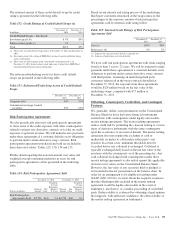
Further detail regarding gains (losses) on fair value hedge derivatives and related hedged items is presented in the following table:
Table 126: Gains (Losses) on Derivatives and Related Hedged Items – Fair Value Hedges
Year ended
December 31, 2014 December 31, 2013 December 31, 2012
Gain
(Loss) on
Derivatives
Recognized
in Income
Gain
(Loss) on
Related
Hedged
Items
Recognized
in Income
Gain
(Loss) on
Derivatives
Recognized
in Income
Gain
(Loss) on
Related
Hedged
Items
Recognized
in Income
Gain
(Loss) on
Derivatives
Recognized
in Income
Gain
(Loss) on
Related
Hedged
Items
Recognized
in Income
In millions Hedged Items Location Amount Amount Amount Amount Amount Amount
Interest rate contracts
U.S. Treasury and
Government
Agencies Securities
Investment securities
(interest income) $(111) $ 116 $ 102 $(107) $(26) $ 23
Interest rate contracts
Other Debt
Securities
Investment securities
(interest income) 9 (8) (1) 1
Interest rate contracts Subordinated debt
Borrowed funds
(interest expense) 78 (106) (393) 368 (30) (9)
Interest rate contracts
Bank notes and
senior debt
Borrowed funds
(interest expense) 45 (52) (351) 343 68 (80)
Total (a) $ 12 $ (42) $(633) $ 596 $ 11 $(65)
(a) The ineffective portion of the change in value of our fair value hedge derivatives resulted in net losses of $30 million for 2014 compared with net losses of $37 million for 2013 and
net losses of $54 million for 2012.
188 The PNC Financial Services Group, Inc. – Form 10-K