PNC Bank 2014 Annual Report Download - page 195
Download and view the complete annual report
Please find page 195 of the 2014 PNC Bank annual report below. You can navigate through the pages in the report by either clicking on the pages listed below, or by using the keyword search tool below to find specific information within the annual report.-
 1
1 -
2
-
3
-
4
-
5
-
6
-
7
-
8
-
9
-
10
-
11
-
12
-
13
-
14
-
15
-
16
-
17
-
18
-
19
-
20
-
21
-
22
-
23
-
24
-
25
-
26
-
27
-
28
-
29
-
30
-
31
-
32
-
33
-
34
-
35
-
36
-
37
-
38
-
39
-
40
-
41
-
42
-
43
-
44
-
45
-
46
-
47
-
48
-
49
-
50
-
51
-
52
-
53
-
54
-
55
-
56
-
57
-
58
-
59
-
60
-
61
-
62
-
63
-
64
-
65
-
66
-
67
-
68
-
69
-
70
-
71
-
72
-
73
-
74
-
75
-
76
-
77
-
78
-
79
-
80
-
81
-
82
-
83
-
84
-
85
-
86
-
87
-
88
-
89
-
90
-
91
-
92
-
93
-
94
-
95
-
96
-
97
-
98
-
99
-
100
-
101
-
102
-
103
-
104
-
105
-
106
-
107
-
108
-
109
-
110
-
111
-
112
-
113
-
114
-
115
-
116
-
117
-
118
-
119
-
120
-
121
-
122
-
123
-
124
-
125
-
126
-
127
-
128
-
129
-
130
-
131
-
132
-
133
-
134
-
135
-
136
-
137
-
138
-
139
-
140
-
141
-
142
-
143
-
144
-
145
-
146
-
147
-
148
-
149
-
150
-
151
-
152
-
153
-
154
-
155
-
156
-
157
-
158
-
159
-
160
-
161
-
162
-
163
-
164
-
165
-
166
-
167
-
168
-
169
-
170
-
171
-
172
-
173
-
174
-
175
-
176
-
177
-
178
-
179
-
180
-
181
-
182
-
183
-
184
-
 185
185 -
 186
186 -
 187
187 -
 188
188 -
 189
189 -
 190
190 -
 191
191 -
 192
192 -
 193
193 -
 194
194 -
 195
195 -
 196
196 -
 197
197 -
 198
198 -
 199
199 -
 200
200 -
 201
201 -
 202
202 -
 203
203 -
 204
204 -
 205
205 -
206
-
207
-
208
-
209
-
210
-
211
-
212
-
213
-
214
-
215
-
216
-
217
-
218
-
219
-
220
-
221
-
222
-
223
-
224
-
225
-
226
-
227
-
228
-
229
-
230
-
231
-
232
-
233
-
234
-
235
-
236
-
237
-
238
-
239
-
240
-
241
-
242
-
243
-
244
-
245
-
246
-
247
-
248
-
249
-
250
-
251
-
252
-
253
-
254
-
255
-
256
-
257
-
258
-
259
-
260
-
261
-
262
-
263
-
264
-
265
-
266
-
267
-
268
 |
 |

N
OTE
13 E
MPLOYEE
B
ENEFIT
P
LANS
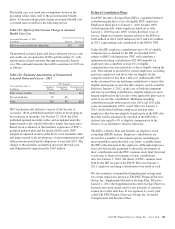
Pension And Postretirement Plans
We have a noncontributory, qualified defined benefit pension plan covering eligible employees. Benefits are determined using a
cash balance formula where earnings credits are a percentage of eligible compensation. Earnings credit percentages for those
employees who were plan participants on December 31, 2009 are frozen at their level earned to that point. Earnings credits for all
employees who become participants on or after January 1, 2010 are a flat 3% of eligible compensation. Plan participants at
December 31, 2009 earn interest based on 30-year Treasury securities with a minimum rate, while new participants on or after
January 1, 2010 are not subject to the minimum rate. Pension contributions are based on an actuarially determined amount
necessary to fund total benefits payable to plan participants.
We also maintain nonqualified supplemental retirement plans for certain employees and provide certain health care and life
insurance benefits for qualifying retired employees (postretirement benefits) through various plans. The nonqualified pension and
postretirement benefit plans are unfunded. PNC currently intends to begin funding some or all of the postretirement medical benefit
obligations through a voluntary employee beneficiary association (VEBA) in mid-to-late 2015. PNC reserves the right to terminate
plans or make plan changes at any time.
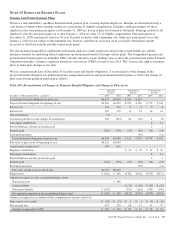
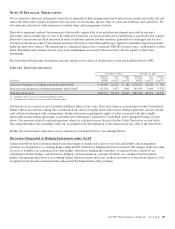
We use a measurement date of December 31 for plan assets and benefit obligations. A reconciliation of the changes in the
projected benefit obligation for qualified pension, nonqualified pension and postretirement benefit plans as well as the change in
plan assets for the qualified pension plan follows.
Table 109: Reconciliation of Changes in Projected Benefit Obligation and Change in Plan Assets
Qualified
Pension
Nonqualified
Pension
Postretirement
Benefits
December 31 (Measurement Date) – in millions 2014 2013 2014 2013 2014 2013
Accumulated benefit obligation at end of year $4,427 $3,890 $ 316 $ 287
Projected benefit obligation at beginning of year $3,966 $4,512 $ 292 $ 362 $ 375 $ 394
Service cost 103 1133356
Interest cost 187 170 12 12 16 14
Plan amendments (7)
Actuarial (gains)/losses and changes in assumptions 504 (453) 40 (26) 4 (9)
Participant contributions 813
Federal Medicare subsidy on benefits paid 22
Benefits paid (254) (376) (25) (20) (31) (34)
Settlement payments (39) (11)
Projected benefit obligation at end of year $4,499 $3,966 $ 322 $ 292 $ 379 $ 375
Fair value of plan assets at beginning of year $4,252 $4,009
Actual return on plan assets 359 619
Employer contribution $25 $59 $21 $30
Participant contributions 813
Federal Medicare subsidy on benefits paid 22
Benefits paid (254) (376) (25) (20) (31) (34)
Settlement payments (39) (11)
Fair value of plan assets at end of year $4,357 $4,252
Funded status $ (142) $ 286 $(322) $(292) $(379) $(375)
Amounts recognized on the consolidated balance sheet
Noncurrent asset $ 286
Current liability $ (31) $ (28) $ (25) $ (29)
Noncurrent liability $ (142) (291) (264) (354) (346)
Net amount recognized on the consolidated balance sheet $ (142) $ 286 $(322) $(292) $(379) $(375)
Amounts recognized in accumulated other comprehensive income consist of:
Prior service cost (credit) $ (22) $ (23) $ 1 $ 1 $ (4) $ (6)
Net actuarial loss 673 239 88 52 31 27
Amount recognized in AOCI $ 651 $ 216 $ 89 $ 53 $ 27 $ 21
The PNC Financial Services Group, Inc. – Form 10-K 177