PNC Bank 2014 Annual Report Download - page 73
Download and view the complete annual report
Please find page 73 of the 2014 PNC Bank annual report below. You can navigate through the pages in the report by either clicking on the pages listed below, or by using the keyword search tool below to find specific information within the annual report.-
 1
1 -
2
-
3
-
4
-
5
-
6
-
7
-
8
-
9
-
10
-
11
-
12
-
13
-
14
-
15
-
16
-
17
-
18
-
19
-
20
-
21
-
22
-
23
-
24
-
25
-
26
-
27
-
28
-
29
-
30
-
31
-
32
-
33
-
34
-
35
-
36
-
37
-
38
-
39
-
40
-
41
-
42
-
43
-
44
-
45
-
46
-
47
-
48
-
49
-
50
-
51
-
52
-
53
-
54
-
55
-
56
-
57
-
58
-
59
-
60
-
61
-
62
-
 63
63 -
 64
64 -
 65
65 -
 66
66 -
 67
67 -
 68
68 -
 69
69 -
 70
70 -
 71
71 -
 72
72 -
 73
73 -
 74
74 -
 75
75 -
 76
76 -
 77
77 -
 78
78 -
 79
79 -
 80
80 -
 81
81 -
 82
82 -
 83
83 -
84
-
85
-
86
-
87
-
88
-
89
-
90
-
91
-
92
-
93
-
94
-
95
-
96
-
97
-
98
-
99
-
100
-
101
-
102
-
103
-
104
-
105
-
106
-
107
-
108
-
109
-
110
-
111
-
112
-
113
-
114
-
115
-
116
-
117
-
118
-
119
-
120
-
121
-
122
-
123
-
124
-
125
-
126
-
127
-
128
-
129
-
130
-
131
-
132
-
133
-
134
-
135
-
136
-
137
-
138
-
139
-
140
-
141
-
142
-
143
-
144
-
145
-
146
-
147
-
148
-
149
-
150
-
151
-
152
-
153
-
154
-
155
-
156
-
157
-
158
-
159
-
160
-
161
-
162
-
163
-
164
-
165
-
166
-
167
-
168
-
169
-
170
-
171
-
172
-
173
-
174
-
175
-
176
-
177
-
178
-
179
-
180
-
181
-
182
-
183
-
184
-
185
-
186
-
187
-
188
-
189
-
190
-
191
-
192
-
193
-
194
-
195
-
196
-
197
-
198
-
199
-
200
-
201
-
202
-
203
-
204
-
205
-
206
-
207
-
208
-
209
-
210
-
211
-
212
-
213
-
214
-
215
-
216
-
217
-
218
-
219
-
220
-
221
-
222
-
223
-
224
-
225
-
226
-
227
-
228
-
229
-
230
-
231
-
232
-
233
-
234
-
235
-
236
-
237
-
238
-
239
-
240
-
241
-
242
-
243
-
244
-
245
-
246
-
247
-
248
-
249
-
250
-
251
-
252
-
253
-
254
-
255
-
256
-
257
-
258
-
259
-
260
-
261
-
262
-
263
-
264
-
265
-
266
-
267
-
268
 |
 |
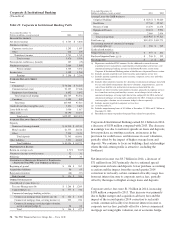
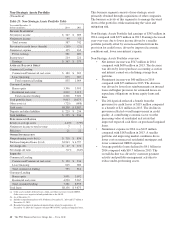
Other noninterest income was $448 million in 2014 compared
with $605 million in 2013. The decrease of $157 million was
driven by lower revenue associated with credit valuations for
customer-related derivatives activities, lower gains on asset
sales and lower derivatives sales.
The provision for credit losses was $107 million in 2014
compared with a benefit of $25 million in 2013 reflecting
portfolio growth over recent quarters paired with the slowing
of the reserve releases related to credit quality improvement.
Net charge-offs were $8 million in 2014, which represents a
decrease of $97 million compared with 2013 primarily
attributable to a decrease in commercial and commercial real
estate charge-offs.
Nonperforming assets were $557 million, a 31% decrease
from December 31, 2013 resulting from continued improving
credit quality.
Noninterest expense was $2.1 billion in 2014, an increase of
$65 million primarily driven by higher incentive
compensation costs associated with business activity.
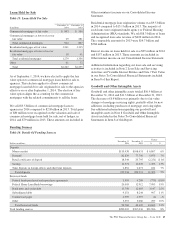
Average loans were $107.9 billion in 2014 compared with
$97.5 billion in 2013, an increase of 11% reflecting strong
growth in Corporate Banking, Real Estate, Business Credit
and Equipment Finance:
• Corporate Banking business provides lending,
treasury management and capital markets-related
products and services to mid-sized and large
corporations, government and not-for-profit entities.
Average loans for this business increased $3.7
billion, or 7%, in 2014 compared with 2013,
primarily due to an increase in loan commitments
from specialty lending businesses.
• PNC Real Estate provides commercial real estate and
real estate-related lending through both conventional
and affordable multifamily financing. Average loans
for this business increased $5.5 billion, or 24%, in 2014
compared with 2013 due to increased originations.
• PNC Business Credit provides asset-based lending.
The loan portfolio is relatively high yielding, with
acceptable risk as the loans are mainly secured by
short-term assets. Average loans increased $1.6
billion, or 14%, in 2014 compared with 2013 due to
increasing deal sizes and higher utilization.
• PNC Equipment Finance provides equipment
financing solutions with $11.9 billion in equipment
finance assets as of December 31, 2014. Average
equipment finance assets in 2014 were $11.2 billion,
an increase of $.6 billion or 5% compared with 2013.
Loan commitments increased 8%, or $16.2 billion, to $212.3
billion at December 31, 2014 compared to $196.1 billion at
December 31, 2013, primarily due to growth in our Real
Estate, Corporate Banking and Business Credit businesses.
Period-end loan balances increased by 12%, or $12.2 billion,
to $113.9 billion at December 31, 2014 compared with $101.8
billion at December 31, 2013.
Average deposits were $73.5 billion in 2014, an increase of
$6.7 billion, or 10%, compared with 2013 as a result of
business growth and inflows into money market and
noninterest-bearing deposits.
The commercial mortgage servicing portfolio was $336 billion
at December 31, 2014, an increase of 9% compared with
December 31, 2013 as servicing additions exceeded portfolio
run-off.
Product Revenue
In addition to credit and deposit products for commercial
customers, Corporate & Institutional Banking offers other
services, including treasury management, capital markets-
related products and services, and commercial mortgage
banking activities, for customers of other business segments.
On a consolidated basis, the revenue from these other services
is included in net interest income, corporate service fees and
other noninterest income. From a segment perspective, the
majority of the revenue and expense related to these services
is reflected in the Corporate & Institutional Banking segment
results and the remainder is reflected in the results of other
businesses. The Other Information section in Table 21 in the
Corporate & Institutional Banking portion of this Business
Segments Review section includes the consolidated revenue to
PNC for these services. A discussion of the consolidated
revenue from these services follows.
Treasury management revenue, comprised of fees and net interest
income from customer deposit balances, totaled $1.3 billion in
2014 compared with $1.3 billion in 2013. Higher average deposit
balances were offset by lower spreads on deposits.
Capital markets revenue includes merger and acquisition
advisory fees, loan syndications, derivatives, foreign exchange,
asset-backed finance revenue, fixed income and equity capital
markets advisory activities. Revenue from capital markets-
related products and services totaled $777 million in 2014
compared with $722 million in 2013. The increase in the
comparison was driven by higher merger and acquisition
advisory fees and to a lesser extent higher loan syndications and
foreign exchange revenue, which was partially offset by lower
revenue associated with credit valuations for customer-related
derivatives activities and related derivatives sales.
Commercial mortgage banking activities include revenue
derived from commercial mortgage servicing (including net
interest income and noninterest income) and revenue derived
from commercial mortgage loans held for sale and related
hedges. Total commercial mortgage banking activities resulted
in revenue of $386 million in 2014 compared with $427 million
in 2013. The decrease in the comparison was mainly due to
lower net commercial mortgage servicing rights valuations.
The PNC Financial Services Group, Inc. – Form 10-K 55