PNC Bank 2014 Annual Report Download - page 62
Download and view the complete annual report
Please find page 62 of the 2014 PNC Bank annual report below. You can navigate through the pages in the report by either clicking on the pages listed below, or by using the keyword search tool below to find specific information within the annual report.-
 1
1 -
2
-
3
-
4
-
5
-
6
-
7
-
8
-
9
-
10
-
11
-
12
-
13
-
14
-
15
-
16
-
17
-
18
-
19
-
20
-
21
-
22
-
23
-
24
-
25
-
26
-
27
-
28
-
29
-
30
-
31
-
32
-
33
-
34
-
35
-
36
-
37
-
38
-
39
-
40
-
41
-
42
-
43
-
44
-
45
-
46
-
47
-
48
-
49
-
50
-
51
-
 52
52 -
 53
53 -
 54
54 -
 55
55 -
 56
56 -
 57
57 -
 58
58 -
 59
59 -
 60
60 -
 61
61 -
 62
62 -
 63
63 -
 64
64 -
 65
65 -
 66
66 -
 67
67 -
 68
68 -
 69
69 -
 70
70 -
 71
71 -
 72
72 -
73
-
74
-
75
-
76
-
77
-
78
-
79
-
80
-
81
-
82
-
83
-
84
-
85
-
86
-
87
-
88
-
89
-
90
-
91
-
92
-
93
-
94
-
95
-
96
-
97
-
98
-
99
-
100
-
101
-
102
-
103
-
104
-
105
-
106
-
107
-
108
-
109
-
110
-
111
-
112
-
113
-
114
-
115
-
116
-
117
-
118
-
119
-
120
-
121
-
122
-
123
-
124
-
125
-
126
-
127
-
128
-
129
-
130
-
131
-
132
-
133
-
134
-
135
-
136
-
137
-
138
-
139
-
140
-
141
-
142
-
143
-
144
-
145
-
146
-
147
-
148
-
149
-
150
-
151
-
152
-
153
-
154
-
155
-
156
-
157
-
158
-
159
-
160
-
161
-
162
-
163
-
164
-
165
-
166
-
167
-
168
-
169
-
170
-
171
-
172
-
173
-
174
-
175
-
176
-
177
-
178
-
179
-
180
-
181
-
182
-
183
-
184
-
185
-
186
-
187
-
188
-
189
-
190
-
191
-
192
-
193
-
194
-
195
-
196
-
197
-
198
-
199
-
200
-
201
-
202
-
203
-
204
-
205
-
206
-
207
-
208
-
209
-
210
-
211
-
212
-
213
-
214
-
215
-
216
-
217
-
218
-
219
-
220
-
221
-
222
-
223
-
224
-
225
-
226
-
227
-
228
-
229
-
230
-
231
-
232
-
233
-
234
-
235
-
236
-
237
-
238
-
239
-
240
-
241
-
242
-
243
-
244
-
245
-
246
-
247
-
248
-
249
-
250
-
251
-
252
-
253
-
254
-
255
-
256
-
257
-
258
-
259
-
260
-
261
-
262
-
263
-
264
-
265
-
266
-
267
-
268
 |
 |
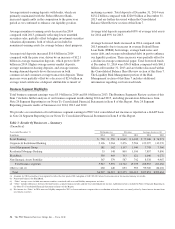
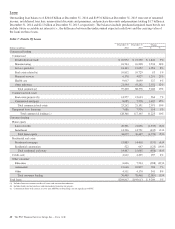
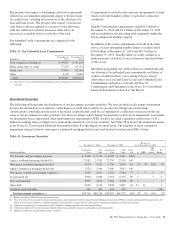
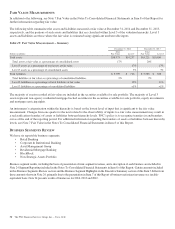
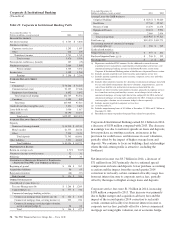
Investment securities represented 16% of total assets at
December 31, 2014 and 19% at December 31, 2013.
We evaluate our investment securities portfolio in light of
changing market conditions and other factors and, where
appropriate, take steps to improve our overall positioning. We
consider the portfolio to be well-diversified and of high
quality. At December 31, 2014, 85% of the securities in the
portfolio were rated AAA/AA, with U.S. Treasury and
government agencies, agency residential mortgage-backed and
agency commercial mortgage-backed securities collectively
representing 59% of the portfolio.
The investment securities portfolio includes both available for
sale and held to maturity securities. Securities classified as
available for sale are carried at fair value with net unrealized
gains and losses, representing the difference between
amortized cost and fair value, included in Shareholders’ equity
as Accumulated other comprehensive income or loss, net of
tax, on our Consolidated Balance Sheet. Securities classified
as held to maturity are carried at amortized cost. As of
December 31, 2014, the amortized cost and fair value of
available for sale securities totaled $43.2 billion and $44.2
billion, respectively, compared to an amortized cost and fair
value as of December 31, 2013 of $48.0 billion and $48.6
billion, respectively. The amortized cost and fair value of held
to maturity securities were $11.6 billion and $12.0 billion,
respectively, at December 31, 2014, compared to $11.7 billion
and $11.8 billion, respectively, at December 31, 2013.
The fair value of investment securities is impacted by interest
rates, credit spreads, market volatility and liquidity conditions.
The fair value of investment securities generally decreases
when interest rates increase and vice versa. In addition, the
fair value generally decreases when credit spreads widen and
vice versa. Net unrealized gains in the total investment
securities portfolio increased to $1.5 billion at December 31,
2014 from $.7 billion at December 31, 2013 primarily due to
the impact of market interest rates and credit spreads. The
comparable amounts for the securities available for sale
portfolio were $1.1 billion and $.6 billion, respectively.
Unrealized gains and losses on available for sale debt
securities do not impact liquidity. However these gains and
losses do affect risk-based capital under the regulatory capital
rules that became effective beginning in 2014 for PNC. Also,
a change in the securities’ credit ratings could impact the
liquidity of the securities and may be indicative of a change in
credit quality, which could affect our risk-weighted assets and,
therefore, our regulatory capital ratios under the regulatory
capital rules in effect starting with 2014. In addition, the
amount representing the credit-related portion of OTTI on
available for sale securities would reduce our earnings and
regulatory capital ratios.
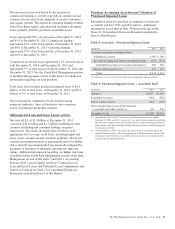
During the second quarter of 2014, we transferred securities
with a fair value of $1.4 billion from available for sale to held
to maturity. We changed our intent and committed to hold
these high-quality securities to maturity in order to reduce the
impact of price volatility on Accumulated other
comprehensive income and certain capital measures, after
taking into consideration market conditions and regulatory
capital requirements under Basel III capital standards. See
additional discussion of this transfer in Note 6 Investment
Securities in our Notes To Consolidated Financial Statements
included in Item 8 of this Report.
The duration of investment securities was 2.2 years at
December 31, 2014. We estimate that, at December 31, 2014,
the effective duration of investment securities was 2.2 years
for an immediate 50 basis points parallel increase in interest
rates and 2.1 years for an immediate 50 basis points parallel
decrease in interest rates. Comparable amounts at
December 31, 2013 for the effective duration of investment
securities were 3.0 years and 2.8 years, respectively.
At least quarterly, we conduct a comprehensive security-level
impairment assessment on all securities. For securities in an
unrealized loss position, we determine whether the loss
represents OTTI. For debt securities that we neither intend to
sell nor believe we will be required to sell prior to expected
recovery, we recognize the credit portion of OTTI charges in
current earnings and include the noncredit portion of OTTI in
Net unrealized gains (losses) on OTTI securities on our
Consolidated Statement of Comprehensive Income and net of
tax in Accumulated other comprehensive income (loss) on our
Consolidated Balance Sheet. In 2014 and 2013 we recognized
OTTI credit losses of $11 million and $16 million,
respectively. The credit losses related to residential mortgage-
backed and asset-backed securities collateralized by non-
agency residential loans.
If economic conditions, including housing values, were to
deteriorate from current levels, and if market volatility and
illiquidity were to deteriorate from current levels, or if market
interest rates were to increase or credit spreads were to widen
appreciably, the valuation of our investment securities
portfolio would likely be adversely affected and we could
incur additional OTTI credit losses that would impact our
Consolidated Income Statement.
Additional information regarding our investment securities is
included in Note 6 Investment Securities and Note 7 Fair
Value in the Notes To Consolidated Financial Statements
included in Item 8 of this Report.
44 The PNC Financial Services Group, Inc. – Form 10-K