PNC Bank 2014 Annual Report Download - page 212
Download and view the complete annual report
Please find page 212 of the 2014 PNC Bank annual report below. You can navigate through the pages in the report by either clicking on the pages listed below, or by using the keyword search tool below to find specific information within the annual report.-
 1
1 -
2
-
3
-
4
-
5
-
6
-
7
-
8
-
9
-
10
-
11
-
12
-
13
-
14
-
15
-
16
-
17
-
18
-
19
-
20
-
21
-
22
-
23
-
24
-
25
-
26
-
27
-
28
-
29
-
30
-
31
-
32
-
33
-
34
-
35
-
36
-
37
-
38
-
39
-
40
-
41
-
42
-
43
-
44
-
45
-
46
-
47
-
48
-
49
-
50
-
51
-
52
-
53
-
54
-
55
-
56
-
57
-
58
-
59
-
60
-
61
-
62
-
63
-
64
-
65
-
66
-
67
-
68
-
69
-
70
-
71
-
72
-
73
-
74
-
75
-
76
-
77
-
78
-
79
-
80
-
81
-
82
-
83
-
84
-
85
-
86
-
87
-
88
-
89
-
90
-
91
-
92
-
93
-
94
-
95
-
96
-
97
-
98
-
99
-
100
-
101
-
102
-
103
-
104
-
105
-
106
-
107
-
108
-
109
-
110
-
111
-
112
-
113
-
114
-
115
-
116
-
117
-
118
-
119
-
120
-
121
-
122
-
123
-
124
-
125
-
126
-
127
-
128
-
129
-
130
-
131
-
132
-
133
-
134
-
135
-
136
-
137
-
138
-
139
-
140
-
141
-
142
-
143
-
144
-
145
-
146
-
147
-
148
-
149
-
150
-
151
-
152
-
153
-
154
-
155
-
156
-
157
-
158
-
159
-
160
-
161
-
162
-
163
-
164
-
165
-
166
-
167
-
168
-
169
-
170
-
171
-
172
-
173
-
174
-
175
-
176
-
177
-
178
-
179
-
180
-
181
-
182
-
183
-
184
-
185
-
186
-
187
-
188
-
189
-
190
-
191
-
192
-
193
-
194
-
195
-
196
-
197
-
198
-
199
-
200
-
201
-
 202
202 -
 203
203 -
 204
204 -
 205
205 -
 206
206 -
 207
207 -
 208
208 -
 209
209 -
 210
210 -
 211
211 -
 212
212 -
 213
213 -
 214
214 -
 215
215 -
 216
216 -
 217
217 -
 218
218 -
 219
219 -
 220
220 -
 221
221 -
 222
222 -
223
-
224
-
225
-
226
-
227
-
228
-
229
-
230
-
231
-
232
-
233
-
234
-
235
-
236
-
237
-
238
-
239
-
240
-
241
-
242
-
243
-
244
-
245
-
246
-
247
-
248
-
249
-
250
-
251
-
252
-
253
-
254
-
255
-
256
-
257
-
258
-
259
-
260
-
261
-
262
-
263
-
264
-
265
-
266
-
267
-
268
 |
 |

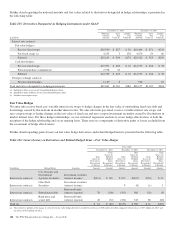
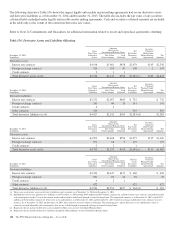
The following derivative Table 136 shows the impact legally enforceable master netting agreements had on our derivative assets
and derivative liabilities as of December 31, 2014 and December 31, 2013. The table also includes the fair value of any securities
collateral held or pledged under legally enforceable master netting agreements. Cash and securities collateral amounts are included
in the table only to the extent of the related net derivative fair values.
Refer to Note 22 Commitments and Guarantees for additional information related to resale and repurchase agreements offsetting.
Table 136: Derivative Assets and Liabilities Offsetting
Gross
Fair Value
Derivative
Assets
Amounts
Offset on the
Consolidated Balance Sheet Net
Fair Value
Derivative
Assets
Securities
Collateral
Held Under
Master Netting
Agreements
Net
Amounts
December 31, 2014
In millions
Fair Value
Offset Amount
Cash
Collateral
Derivative assets
Interest rate contracts $4,918 $1,981 $458 $2,479 $143 $2,336
Foreign exchange contracts 314 159 47 108 1 107
Credit contracts 2 1 1
Total derivative assets (a) (b) $5,234 $2,141 $506 $2,587 (c) $144 $2,443
Gross
Fair Value
Derivative
Liabilities
Amounts
Offset on the
Consolidated Balance Sheet Net
Fair Value
Derivative
Liabilities
Securities
Collateral
Pledged Under
Master Netting
Agreements
Net
Amounts
December 31, 2014
In millions
Fair Value
Offset Amount
Cash
Collateral
Derivative liabilities
Interest rate contracts $3,272 $2,057 $483 $ 732 $ 732
Foreign exchange contracts 241 80 20 141 141
Credit contracts 4 4
Other contracts 510 510 510
Total derivative liabilities (a) (b) $4,027 $2,141 $503 $1,383 (d) $1,383
Gross
Fair Value
Derivative
Assets
Amounts
Offset on the
Consolidated Balance Sheet Net
Fair Value
Derivative
Assets
Securities
Collateral
Held Under
Master Netting
Agreements
Net
Amounts
December 31, 2013
In millions
Fair Value
Offset Amount
Cash
Collateral
Derivative assets
Interest rate contracts $4,599 $2,468 $556 $1,575 $115 $1,460
Foreign exchange contracts 192 64 9 119 119
Credit contracts 2 1 1 1
Total derivative assets (a) (b) $4,793 $2,533 $565 $1,695 (c) $115 $1,580
Gross
Fair Value
Derivative
Liabilities
Amounts
Offset on the
Consolidated Balance Sheet Net Fair
Value
Derivative
Liabilities
Securities
Collateral
Pledged Under
Master Netting
Agreements
Net
Amounts
December 31, 2013
In millions
Fair Value
Offset Amount
Cash
Collateral
Derivative liabilities
Interest rate contracts $3,326 $2,447 $473 $ 406 $ 406
Foreign exchange contracts 182 83 23 76 76
Credit contracts 4 3 1
Other contracts 422 422 422
Total derivative liabilities (a) (b) $3,934 $2,533 $497 $ 904 (d) $ 904
(a) There were no derivative assets or derivative liabilities equity contracts as of December 31, 2014 and December 31, 2013.
(b) Included derivative assets and derivative liabilities as of December 31, 2014 totaling $807 million and $657 million, respectively, related to interest rate contracts executed bilaterally
with counterparties in the U.S. over-the-counter market and novated to and cleared through a central clearing house. The comparable amounts as of December 31, 2013 totaled $331
million and $224 million, respectively. Derivative assets and liabilities as of December 31, 2014 and December 31, 2013 related to exchange-traded interest rate contracts were not
material. As of December 31, 2014 and December 31, 2013, these contracts were not subject to offsetting. The remaining gross and net derivative assets and liabilities relate to
contracts executed bilaterally with counterparties that are not settled through an organized exchange or central clearing house.
(c) Represents the net amount of derivative assets included in Other assets on our Consolidated Balance Sheet.
(d) Represents the net amount of derivative liabilities included in Other liabilities on our Consolidated Balance Sheet.
194 The PNC Financial Services Group, Inc. – Form 10-K