PNC Bank 2014 Annual Report Download - page 155
Download and view the complete annual report
Please find page 155 of the 2014 PNC Bank annual report below. You can navigate through the pages in the report by either clicking on the pages listed below, or by using the keyword search tool below to find specific information within the annual report.-
 1
1 -
2
-
3
-
4
-
5
-
6
-
7
-
8
-
9
-
10
-
11
-
12
-
13
-
14
-
15
-
16
-
17
-
18
-
19
-
20
-
21
-
22
-
23
-
24
-
25
-
26
-
27
-
28
-
29
-
30
-
31
-
32
-
33
-
34
-
35
-
36
-
37
-
38
-
39
-
40
-
41
-
42
-
43
-
44
-
45
-
46
-
47
-
48
-
49
-
50
-
51
-
52
-
53
-
54
-
55
-
56
-
57
-
58
-
59
-
60
-
61
-
62
-
63
-
64
-
65
-
66
-
67
-
68
-
69
-
70
-
71
-
72
-
73
-
74
-
75
-
76
-
77
-
78
-
79
-
80
-
81
-
82
-
83
-
84
-
85
-
86
-
87
-
88
-
89
-
90
-
91
-
92
-
93
-
94
-
95
-
96
-
97
-
98
-
99
-
100
-
101
-
102
-
103
-
104
-
105
-
106
-
107
-
108
-
109
-
110
-
111
-
112
-
113
-
114
-
115
-
116
-
117
-
118
-
119
-
120
-
121
-
122
-
123
-
124
-
125
-
126
-
127
-
128
-
129
-
130
-
131
-
132
-
133
-
134
-
135
-
136
-
137
-
138
-
139
-
140
-
141
-
142
-
143
-
144
-
 145
145 -
 146
146 -
 147
147 -
 148
148 -
 149
149 -
 150
150 -
 151
151 -
 152
152 -
 153
153 -
 154
154 -
 155
155 -
 156
156 -
 157
157 -
 158
158 -
 159
159 -
 160
160 -
 161
161 -
 162
162 -
 163
163 -
 164
164 -
 165
165 -
166
-
167
-
168
-
169
-
170
-
171
-
172
-
173
-
174
-
175
-
176
-
177
-
178
-
179
-
180
-
181
-
182
-
183
-
184
-
185
-
186
-
187
-
188
-
189
-
190
-
191
-
192
-
193
-
194
-
195
-
196
-
197
-
198
-
199
-
200
-
201
-
202
-
203
-
204
-
205
-
206
-
207
-
208
-
209
-
210
-
211
-
212
-
213
-
214
-
215
-
216
-
217
-
218
-
219
-
220
-
221
-
222
-
223
-
224
-
225
-
226
-
227
-
228
-
229
-
230
-
231
-
232
-
233
-
234
-
235
-
236
-
237
-
238
-
239
-
240
-
241
-
242
-
243
-
244
-
245
-
246
-
247
-
248
-
249
-
250
-
251
-
252
-
253
-
254
-
255
-
256
-
257
-
258
-
259
-
260
-
261
-
262
-
263
-
264
-
265
-
266
-
267
-
268
 |
 |

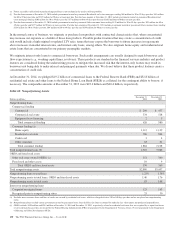
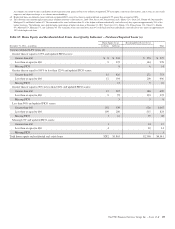
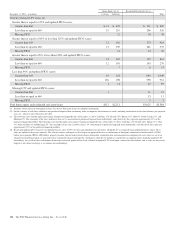
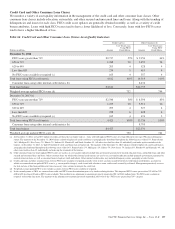
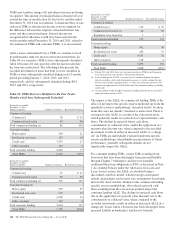
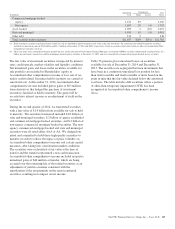
Credit Card and Other Consumer Loan Classes
We monitor a variety of asset quality information in the management of the credit card and other consumer loan classes. Other
consumer loan classes include education, automobile, and other secured and unsecured lines and loans. Along with the trending of
delinquencies and losses for each class, FICO credit score updates are generally obtained monthly, as well as a variety of credit
bureau attributes. Loans with high FICO scores tend to have a lower likelihood of loss. Conversely, loans with low FICO scores
tend to have a higher likelihood of loss.
Table 66: Credit Card and Other Consumer Loan Classes Asset Quality Indicators
Credit Card (a) Other Consumer (b)
Dollars in millions Amount
% of Total Loans
Using FICO
Credit Metric Amount
% of Total Loans
Using FICO
Credit Metric
December 31, 2014
FICO score greater than 719 $2,717 59% $ 9,156 64%
650 to 719 1,288 28 3,459 24
620 to 649 203 4 528 4
Less than 620 239 5 619 4
No FICO score available or required (c) 165 4 557 4
Total loans using FICO credit metric 4,612 100% 14,319 100%
Consumer loans using other internal credit metrics (b) 8,434
Total loan balance $4,612 $22,753
Weighted-average updated FICO score (d) 732 744
December 31, 2013 (e)
FICO score greater than 719 $2,546 58% $ 8,596 63%
650 to 719 1,253 28 3,511 26
620 to 649 203 4 527 4
Less than 620 258 6 628 4
No FICO score available or required (c) 165 4 474 3
Total loans using FICO credit metric 4,425 100% 13,736 100%
Consumer loans using other internal credit metrics (b) 8,795
Total loan balance $4,425 $22,531
Weighted-average updated FICO score (d) 730 741
(a) At December 31, 2014, we had $35 million of credit card loans that are higher risk (i.e., loans with both updated FICO scores less than 660 and in late stage (90+ days) delinquency
status). The majority of the December 31, 2014 balance related to higher risk credit card loans is geographically distributed throughout the following areas: Ohio 17%, Pennsylvania
16%, Michigan 9%, New Jersey 7%, Illinois 7%, Indiana 6%, Florida 6% and North Carolina 4%. All other states had less than 4% individually and make up the remainder of the
balance. At December 31, 2013, we had $35 million of credit card loans that are higher risk. The majority of the December 31, 2013 balance related to higher risk credit card loans is
geographically distributed throughout the following areas: Ohio 18%, Pennsylvania 17%, Michigan 11%, Illinois 7%, New Jersey 7%, Indiana 6%, Florida 6% and Kentucky 4%. All
other states had less than 4% individually and make up the remainder of the balance.
(b) Other consumer loans for which updated FICO scores are used as an asset quality indicator include non-government guaranteed or insured education loans, automobile loans and other
secured and unsecured lines and loans. Other consumer loans for which other internal credit metrics are used as an asset quality indicator include primarily government guaranteed or
insured education loans, as well as consumer loans to high net worth individuals. Other internal credit metrics may include delinquency status, geography or other factors.
(c) Credit card loans and other consumer loans with no FICO score available or required generally refers to new accounts issued to borrowers with limited credit history, accounts for
which we cannot obtain an updated FICO score (e.g., recent profile changes), cards issued with a business name, and/or cards secured by collateral. Management proactively assesses
the risk and size of this loan portfolio and, when necessary, takes actions to mitigate the credit risk.
(d) Weighted-average updated FICO score excludes accounts with no FICO score available or required.
(e) In the second quarter of 2014, we corrected our credit card FICO score determination process by further refining the data. This impacted FICO scores greater than 719, 650 to 719,
620 to 649, less than 620 and no FICO score available. This resulted in an adjustment to amounts previously reported in 2013 of $242 million from “No FICO score available or
required” to the other line items. The majority of the adjustment to amounts previously reported in 2013 went to the “FICO score greater than 719” category.
The PNC Financial Services Group, Inc. – Form 10-K 137