PNC Bank 2014 Annual Report Download - page 58
Download and view the complete annual report
Please find page 58 of the 2014 PNC Bank annual report below. You can navigate through the pages in the report by either clicking on the pages listed below, or by using the keyword search tool below to find specific information within the annual report.-
 1
1 -
2
-
3
-
4
-
5
-
6
-
7
-
8
-
9
-
10
-
11
-
12
-
13
-
14
-
15
-
16
-
17
-
18
-
19
-
20
-
21
-
22
-
23
-
24
-
25
-
26
-
27
-
28
-
29
-
30
-
31
-
32
-
33
-
34
-
35
-
36
-
37
-
38
-
39
-
40
-
41
-
42
-
43
-
44
-
45
-
46
-
47
-
 48
48 -
 49
49 -
 50
50 -
 51
51 -
 52
52 -
 53
53 -
 54
54 -
 55
55 -
 56
56 -
 57
57 -
 58
58 -
 59
59 -
 60
60 -
 61
61 -
 62
62 -
 63
63 -
 64
64 -
 65
65 -
 66
66 -
 67
67 -
 68
68 -
69
-
70
-
71
-
72
-
73
-
74
-
75
-
76
-
77
-
78
-
79
-
80
-
81
-
82
-
83
-
84
-
85
-
86
-
87
-
88
-
89
-
90
-
91
-
92
-
93
-
94
-
95
-
96
-
97
-
98
-
99
-
100
-
101
-
102
-
103
-
104
-
105
-
106
-
107
-
108
-
109
-
110
-
111
-
112
-
113
-
114
-
115
-
116
-
117
-
118
-
119
-
120
-
121
-
122
-
123
-
124
-
125
-
126
-
127
-
128
-
129
-
130
-
131
-
132
-
133
-
134
-
135
-
136
-
137
-
138
-
139
-
140
-
141
-
142
-
143
-
144
-
145
-
146
-
147
-
148
-
149
-
150
-
151
-
152
-
153
-
154
-
155
-
156
-
157
-
158
-
159
-
160
-
161
-
162
-
163
-
164
-
165
-
166
-
167
-
168
-
169
-
170
-
171
-
172
-
173
-
174
-
175
-
176
-
177
-
178
-
179
-
180
-
181
-
182
-
183
-
184
-
185
-
186
-
187
-
188
-
189
-
190
-
191
-
192
-
193
-
194
-
195
-
196
-
197
-
198
-
199
-
200
-
201
-
202
-
203
-
204
-
205
-
206
-
207
-
208
-
209
-
210
-
211
-
212
-
213
-
214
-
215
-
216
-
217
-
218
-
219
-
220
-
221
-
222
-
223
-
224
-
225
-
226
-
227
-
228
-
229
-
230
-
231
-
232
-
233
-
234
-
235
-
236
-
237
-
238
-
239
-
240
-
241
-
242
-
243
-
244
-
245
-
246
-
247
-
248
-
249
-
250
-
251
-
252
-
253
-
254
-
255
-
256
-
257
-
258
-
259
-
260
-
261
-
262
-
263
-
264
-
265
-
266
-
267
-
268
 |
 |

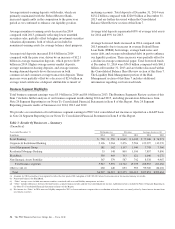
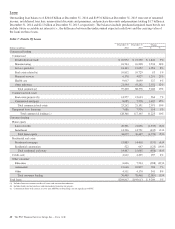
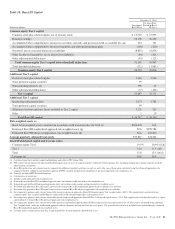
Loans
Outstanding loan balances of $204.8 billion at December 31, 2014 and $195.6 billion at December 31, 2013 were net of unearned
income, net deferred loan fees, unamortized discounts and premiums, and purchase discounts and premiums totaling $1.7 billion at
December 31, 2014 and $2.1 billion at December 31, 2013, respectively. The balances include purchased impaired loans but do not
include future accretable net interest (i.e., the difference between the undiscounted expected cash flows and the carrying value of
the loan) on those loans.
Table 7: Details Of Loans
December 31 December 31 Change
Dollars in millions 2014 2013 $ %
Commercial lending
Commercial
Retail/wholesale trade $ 16,972 $ 15,530 $ 1,442 9%
Manufacturing 18,744 16,208 2,536 16%
Service providers 14,103 13,052 1,051 8%
Real estate related (a) 10,812 10,729 83 1%
Financial services 6,178 4,927 1,251 25%
Health care 9,017 8,690 327 4%
Other industries 21,594 19,242 2,352 12%
Total commercial 97,420 88,378 9,042 10%
Commercial real estate
Real estate projects (b) 14,577 13,613 964 7%
Commercial mortgage 8,685 7,578 1,107 15%
Total commercial real estate 23,262 21,191 2,071 10%
Equipment lease financing 7,686 7,576 110 1%
Total commercial lending (c) 128,368 117,145 11,223 10%
Consumer lending
Home equity
Lines of credit 20,361 21,696 (1,335) (6)%
Installment 14,316 14,751 (435) (3)%
Total home equity 34,677 36,447 (1,770) (5)%
Residential real estate
Residential mortgage 13,885 14,418 (533) (4)%
Residential construction 522 647 (125) (19)%
Total residential real estate 14,407 15,065 (658) (4)%
Credit card 4,612 4,425 187 4%
Other consumer
Education 6,626 7,534 (908) (12)%
Automobile 11,616 10,827 789 7%
Other 4,511 4,170 341 8%
Total consumer lending 76,449 78,468 (2,019) (3)%
Total loans $204,817 $195,613 $ 9,204 5%
(a) Includes loans to customers in the real estate and construction industries.
(b) Includes both construction loans and intermediate financing for projects.
(c) Construction loans with interest reserves and A/B Note restructurings are not significant to PNC.
40 The PNC Financial Services Group, Inc. – Form 10-K