PNC Bank 2014 Annual Report Download - page 175
Download and view the complete annual report
Please find page 175 of the 2014 PNC Bank annual report below. You can navigate through the pages in the report by either clicking on the pages listed below, or by using the keyword search tool below to find specific information within the annual report.-
 1
1 -
2
-
3
-
4
-
5
-
6
-
7
-
8
-
9
-
10
-
11
-
12
-
13
-
14
-
15
-
16
-
17
-
18
-
19
-
20
-
21
-
22
-
23
-
24
-
25
-
26
-
27
-
28
-
29
-
30
-
31
-
32
-
33
-
34
-
35
-
36
-
37
-
38
-
39
-
40
-
41
-
42
-
43
-
44
-
45
-
46
-
47
-
48
-
49
-
50
-
51
-
52
-
53
-
54
-
55
-
56
-
57
-
58
-
59
-
60
-
61
-
62
-
63
-
64
-
65
-
66
-
67
-
68
-
69
-
70
-
71
-
72
-
73
-
74
-
75
-
76
-
77
-
78
-
79
-
80
-
81
-
82
-
83
-
84
-
85
-
86
-
87
-
88
-
89
-
90
-
91
-
92
-
93
-
94
-
95
-
96
-
97
-
98
-
99
-
100
-
101
-
102
-
103
-
104
-
105
-
106
-
107
-
108
-
109
-
110
-
111
-
112
-
113
-
114
-
115
-
116
-
117
-
118
-
119
-
120
-
121
-
122
-
123
-
124
-
125
-
126
-
127
-
128
-
129
-
130
-
131
-
132
-
133
-
134
-
135
-
136
-
137
-
138
-
139
-
140
-
141
-
142
-
143
-
144
-
145
-
146
-
147
-
148
-
149
-
150
-
151
-
152
-
153
-
154
-
155
-
156
-
157
-
158
-
159
-
160
-
161
-
162
-
163
-
164
-
 165
165 -
 166
166 -
 167
167 -
 168
168 -
 169
169 -
 170
170 -
 171
171 -
 172
172 -
 173
173 -
 174
174 -
 175
175 -
 176
176 -
 177
177 -
 178
178 -
 179
179 -
 180
180 -
 181
181 -
 182
182 -
 183
183 -
 184
184 -
 185
185 -
186
-
187
-
188
-
189
-
190
-
191
-
192
-
193
-
194
-
195
-
196
-
197
-
198
-
199
-
200
-
201
-
202
-
203
-
204
-
205
-
206
-
207
-
208
-
209
-
210
-
211
-
212
-
213
-
214
-
215
-
216
-
217
-
218
-
219
-
220
-
221
-
222
-
223
-
224
-
225
-
226
-
227
-
228
-
229
-
230
-
231
-
232
-
233
-
234
-
235
-
236
-
237
-
238
-
239
-
240
-
241
-
242
-
243
-
244
-
245
-
246
-
247
-
248
-
249
-
250
-
251
-
252
-
253
-
254
-
255
-
256
-
257
-
258
-
259
-
260
-
261
-
262
-
263
-
264
-
265
-
266
-
267
-
268
 |
 |

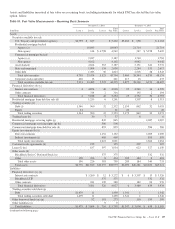
Assets and liabilities measured at fair value on a recurring basis, including instruments for which PNC has elected the fair value
option, follow.
Table 83: Fair Value Measurements – Recurring Basis Summary
December 31, 2014 December 31, 2013
In millions Level 1 Level 2 Level 3
Total
Fair Value Level 1 Level 2 Level 3
Total
Fair Value
Assets
Securities available for sale
U.S. Treasury and government agencies $4,795 $ 627 $ 5,422 $3,460 $ 658 $ 4,118
Residential mortgage-backed
Agency (a) 18,043 18,043 21,714 21,714
Non-agency 144 $ 4,798 4,942 247 $ 5,358 5,605
Commercial mortgage-backed
Agency (a) 2,187 2,187 1,763 1,763
Non-agency 4,162 4,162 4,042 4,042
Asset-backed 4,624 563 5,187 5,131 641 5,772
State and municipal 1,904 134 2,038 2,284 333 2,617
Other debt 1,783 30 1,813 2,505 38 2,543
Total debt securities 4,795 33,474 5,525 43,794 3,460 38,344 6,370 48,174
Corporate stocks and other 426 15 441 417 16 433
Total securities available for sale 5,221 33,489 5,525 44,235 3,877 38,360 6,370 48,607
Financial derivatives (b) (c)
Interest rate contracts 4 4,874 40 4,918 25 4,540 34 4,599
Other contracts 314 2 316 192 2 194
Total financial derivatives 4 5,188 42 5,234 25 4,732 36 4,793
Residential mortgage loans held for sale (d) 1,255 6 1,261 1,307 8 1,315
Trading securities (e)
Debt (f) 1,340 960 32 2,332 2,159 862 32 3,053
Equity 21 21 20 20
Total trading securities 1,361 960 32 2,353 2,179 862 32 3,073
Trading loans (b) 30 7 37 6 6
Residential mortgage servicing rights (g) 845 845 1,087 1,087
Commercial mortgage servicing rights (g) (h) 506 506
Commercial mortgage loans held for sale (d) 893 893 586 586
Equity investments (b) (i)
Direct investments 1,152 1,152 1,069 1,069
Indirect investments (j) 469 469 595 595
Total equity investments 1,621 1,621 1,664 1,664
Customer resale agreements (k) 155 155 207 207
Loans (l) (m) 637 397 1,034 623 527 1,150
Other assets (b)
BlackRock Series C Preferred Stock (n) 375 375 332 332
Other 190 226 8 424 209 184 8 401
Total other assets 190 226 383 799 209 184 340 733
Total assets $6,776 $41,940 $10,257 $58,973 $6,290 $46,281 $10,650 $63,221
Liabilities
Financial derivatives (c) (o)
Interest rate contracts $ 3,260 $ 12 $ 3,272 $ 6 $ 3,307 $ 13 $ 3,326
BlackRock LTIP 375 375 332 332
Other contracts 241 139 380 182 94 276
Total financial derivatives 3,501 526 4,027 6 3,489 439 3,934
Trading securities sold short (p)
Debt $1,479 11 1,490 1,341 1 1,342
Total trading securities sold short 1,479 11 1,490 1,341 1 1,342
Other borrowed funds (m) (p) 92 181 273 110 199 309
Other liabilities (o) 9 9
Total liabilities $1,479 $ 3,604 $ 716 $ 5,799 $1,347 $ 3,600 $ 638 $ 5,585
(continued on following page)
The PNC Financial Services Group, Inc. – Form 10-K 157