PNC Bank 2014 Annual Report Download - page 236
Download and view the complete annual report
Please find page 236 of the 2014 PNC Bank annual report below. You can navigate through the pages in the report by either clicking on the pages listed below, or by using the keyword search tool below to find specific information within the annual report.-
 1
1 -
2
-
3
-
4
-
5
-
6
-
7
-
8
-
9
-
10
-
11
-
12
-
13
-
14
-
15
-
16
-
17
-
18
-
19
-
20
-
21
-
22
-
23
-
24
-
25
-
26
-
27
-
28
-
29
-
30
-
31
-
32
-
33
-
34
-
35
-
36
-
37
-
38
-
39
-
40
-
41
-
42
-
43
-
44
-
45
-
46
-
47
-
48
-
49
-
50
-
51
-
52
-
53
-
54
-
55
-
56
-
57
-
58
-
59
-
60
-
61
-
62
-
63
-
64
-
65
-
66
-
67
-
68
-
69
-
70
-
71
-
72
-
73
-
74
-
75
-
76
-
77
-
78
-
79
-
80
-
81
-
82
-
83
-
84
-
85
-
86
-
87
-
88
-
89
-
90
-
91
-
92
-
93
-
94
-
95
-
96
-
97
-
98
-
99
-
100
-
101
-
102
-
103
-
104
-
105
-
106
-
107
-
108
-
109
-
110
-
111
-
112
-
113
-
114
-
115
-
116
-
117
-
118
-
119
-
120
-
121
-
122
-
123
-
124
-
125
-
126
-
127
-
128
-
129
-
130
-
131
-
132
-
133
-
134
-
135
-
136
-
137
-
138
-
139
-
140
-
141
-
142
-
143
-
144
-
145
-
146
-
147
-
148
-
149
-
150
-
151
-
152
-
153
-
154
-
155
-
156
-
157
-
158
-
159
-
160
-
161
-
162
-
163
-
164
-
165
-
166
-
167
-
168
-
169
-
170
-
171
-
172
-
173
-
174
-
175
-
176
-
177
-
178
-
179
-
180
-
181
-
182
-
183
-
184
-
185
-
186
-
187
-
188
-
189
-
190
-
191
-
192
-
193
-
194
-
195
-
196
-
197
-
198
-
199
-
200
-
201
-
202
-
203
-
204
-
205
-
206
-
207
-
208
-
209
-
210
-
211
-
212
-
213
-
214
-
215
-
216
-
217
-
218
-
219
-
220
-
221
-
222
-
223
-
224
-
225
-
 226
226 -
 227
227 -
 228
228 -
 229
229 -
 230
230 -
 231
231 -
 232
232 -
 233
233 -
 234
234 -
 235
235 -
 236
236 -
 237
237 -
 238
238 -
 239
239 -
 240
240 -
 241
241 -
 242
242 -
 243
243 -
 244
244 -
 245
245 -
 246
246 -
247
-
248
-
249
-
250
-
251
-
252
-
253
-
254
-
255
-
256
-
257
-
258
-
259
-
260
-
261
-
262
-
263
-
264
-
265
-
266
-
267
-
268
 |
 |

N
OTE
23 P
ARENT
C
OMPANY
Summarized financial information of the parent company is as
follows:
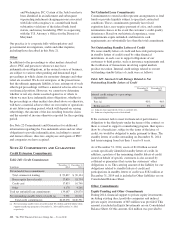
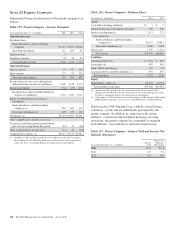
Table 155: Parent Company – Income Statement
Year ended December 31 – in millions 2014 2013 2012
Operating Revenue
Dividends from:
Bank subsidiaries and bank holding
company $3,115 $3,105 $2,660
Non-bank subsidiaries 115 205 91
Interest income 4
Noninterest income 30 28 22
Total operating revenue 3,264 3,338 2,773
Operating Expense
Interest expense 97 107 242
Other expense 127 93 359
Total operating expense 224 200 601
Income before income taxes and equity in
undistributed net income of subsidiaries 3,040 3,138 2,172
Income tax benefits (61) (89) (175)
Income before equity in undistributed net
income of subsidiaries 3,101 3,227 2,347
Equity in undistributed net income of
subsidiaries:
Bank subsidiaries and bank holding
company (a) 854 845 413
Non-bank subsidiaries (a) 229 129 241
Net income (a) $4,184 $4,201 $3,001
Other comprehensive income, net of tax:
Net pension and other postretirement benefit
plan activity arising during the period (17) 34 (40)
Other comprehensive income (loss) (17) 34 (40)
Comprehensive income (a) $4,167 $4,235 $2,961
(a) Amounts for 2013 and 2012 periods have been updated to reflect the first quarter
2014 adoption of ASU 2014-01 related to investments in low income housing tax
credits. See Note 1 Accounting Policies for further detail of the adoption.
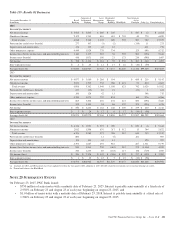
Table 156: Parent Company – Balance Sheet
December 31 – in millions 2014 2013
Assets
Cash held at banking subsidiary $ 1 $ 1
Restricted deposits with banking subsidiary 400 400
Interest-earning deposits 2,013 221
Investments in:
Bank subsidiaries and bank holding
company (a) 41,537 40,611
Non-bank subsidiaries (a) 2,480 2,250
Other assets 1,399 1,201
Total assets $47,830 $44,684
Liabilities
Subordinated debt (b) $ 1,618 $ 824
Senior debt (b) 889 856
Bank affiliate borrowings 102 63
Accrued expenses and other liabilities (a) 670 607
Total liabilities 3,279 2,350
Equity
Shareholders’ equity (a) 44,551 42,334
Total liabilities and equity $47,830 $44,684
(a) Amounts for 2013 periods have been updated to reflect the first quarter 2014
adoption of ASU 2014-01 related to investments in low income housing tax credits.
See Note 1 Accounting Policies for further detail of the adoption.
(b) At December 31, 2014, debt that contractually matures in 2015 through 2019 totaled
$400 million (senior debt), zero, zero, zero and $700 million (subordinated debt).
Debt issued by PNC Funding Corp, a wholly-owned finance
subsidiary, is fully and unconditionally guaranteed by the
parent company. In addition, in connection with certain
affiliates’ commercial and residential mortgage servicing
operations, the parent company has committed to maintain
such affiliates’ net worth above minimum requirements.
Table 157: Parent Company – Interest Paid and Income Tax
Refunds (Payments)
Year ended December 31 – in millions
Interest
Paid
Income Tax
Refunds /
(Payments)
2014 $103 $ (13)
2013 117 91
2012 255 453
218 The PNC Financial Services Group, Inc. – Form 10-K