PNC Bank 2014 Annual Report Download - page 149
Download and view the complete annual report
Please find page 149 of the 2014 PNC Bank annual report below. You can navigate through the pages in the report by either clicking on the pages listed below, or by using the keyword search tool below to find specific information within the annual report.-
 1
1 -
2
-
3
-
4
-
5
-
6
-
7
-
8
-
9
-
10
-
11
-
12
-
13
-
14
-
15
-
16
-
17
-
18
-
19
-
20
-
21
-
22
-
23
-
24
-
25
-
26
-
27
-
28
-
29
-
30
-
31
-
32
-
33
-
34
-
35
-
36
-
37
-
38
-
39
-
40
-
41
-
42
-
43
-
44
-
45
-
46
-
47
-
48
-
49
-
50
-
51
-
52
-
53
-
54
-
55
-
56
-
57
-
58
-
59
-
60
-
61
-
62
-
63
-
64
-
65
-
66
-
67
-
68
-
69
-
70
-
71
-
72
-
73
-
74
-
75
-
76
-
77
-
78
-
79
-
80
-
81
-
82
-
83
-
84
-
85
-
86
-
87
-
88
-
89
-
90
-
91
-
92
-
93
-
94
-
95
-
96
-
97
-
98
-
99
-
100
-
101
-
102
-
103
-
104
-
105
-
106
-
107
-
108
-
109
-
110
-
111
-
112
-
113
-
114
-
115
-
116
-
117
-
118
-
119
-
120
-
121
-
122
-
123
-
124
-
125
-
126
-
127
-
128
-
129
-
130
-
131
-
132
-
133
-
134
-
135
-
136
-
137
-
138
-
 139
139 -
 140
140 -
 141
141 -
 142
142 -
 143
143 -
 144
144 -
 145
145 -
 146
146 -
 147
147 -
 148
148 -
 149
149 -
 150
150 -
 151
151 -
 152
152 -
 153
153 -
 154
154 -
 155
155 -
 156
156 -
 157
157 -
 158
158 -
 159
159 -
160
-
161
-
162
-
163
-
164
-
165
-
166
-
167
-
168
-
169
-
170
-
171
-
172
-
173
-
174
-
175
-
176
-
177
-
178
-
179
-
180
-
181
-
182
-
183
-
184
-
185
-
186
-
187
-
188
-
189
-
190
-
191
-
192
-
193
-
194
-
195
-
196
-
197
-
198
-
199
-
200
-
201
-
202
-
203
-
204
-
205
-
206
-
207
-
208
-
209
-
210
-
211
-
212
-
213
-
214
-
215
-
216
-
217
-
218
-
219
-
220
-
221
-
222
-
223
-
224
-
225
-
226
-
227
-
228
-
229
-
230
-
231
-
232
-
233
-
234
-
235
-
236
-
237
-
238
-
239
-
240
-
241
-
242
-
243
-
244
-
245
-
246
-
247
-
248
-
249
-
250
-
251
-
252
-
253
-
254
-
255
-
256
-
257
-
258
-
259
-
260
-
261
-
262
-
263
-
264
-
265
-
266
-
267
-
268
 |
 |

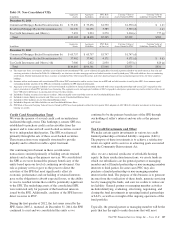
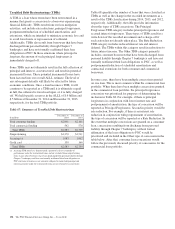
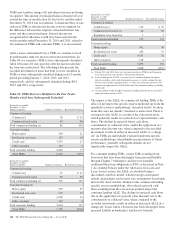
Nonperforming loans also include certain loans whose terms
have been restructured in a manner that grants a concession to
a borrower experiencing financial difficulties. In accordance
with applicable accounting guidance, these loans are
considered TDRs. See Note 1 Accounting Policies and the
TDR section of this Note 3 for additional information. For the
twelve months ended December 31, 2014, $1.2 billion of
Consumer loans held for sale, loans accounted for under the
fair value option, pooled purchased impaired loans, as well as
certain government insured or guaranteed loans which were
evaluated for TDR consideration, are not classified as TDRs.
The comparable amount for the twelve months ended
December 31, 2013 was $2.3 billion.
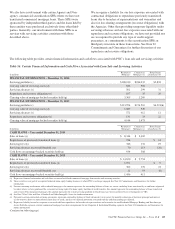
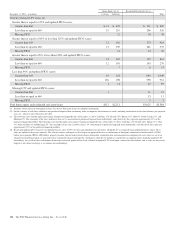
Total nonperforming loans in the nonperforming assets table
above include TDRs of $1.4 billion at December 31, 2014 and
$1.5 billion at December 31, 2013. TDRs that are performing,
including all credit card TDR loans, totaled $1.2 billion at
December 31, 2014 and December 31, 2013, respectively, and
are excluded from nonperforming loans. These performing
TDR loans, excluding credit cards which are not placed on
nonaccrual status as permitted by regulatory guidance, have
demonstrated a period of at least six months of consecutive
performance under the restructured terms. Loans where
borrowers have been discharged from personal liability
through Chapter 7 bankruptcy and have not formally
reaffirmed their loan obligations to PNC and loans to
borrowers not currently obligated to make both principal and
interest payments under the restructured terms are not returned
to accrual status.
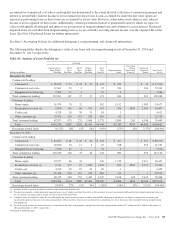
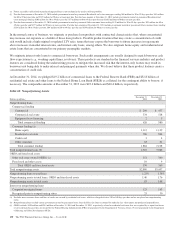
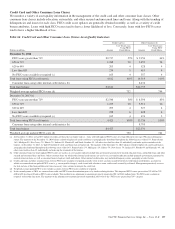
Additional Asset Quality Indicators
We have two overall portfolio segments – Commercial
Lending and Consumer Lending. Each of these two segments
is comprised of multiple loan classes. Classes are
characterized by similarities in initial measurement, risk
attributes and the manner in which we monitor and assess
credit risk. The Commercial Lending segment is comprised of
the commercial, commercial real estate, equipment lease
financing, and commercial purchased impaired loan classes.
The Consumer Lending segment is comprised of the home
equity, residential real estate, credit card, other consumer, and
consumer purchased impaired loan classes. Asset quality
indicators for each of these loan classes are discussed in more
detail below.
Commercial Lending Asset Classes
Commercial Loan Class
For commercial loans, we monitor the performance of the
borrower in a disciplined and regular manner based upon the
level of credit risk inherent in the loan. To evaluate the level
of credit risk, we assign an internal risk rating reflecting the
borrower’s PD and LGD. This two-dimensional credit risk
rating methodology provides granularity in the risk monitoring
process on an ongoing basis. These ratings are reviewed and
updated on a risk-adjusted basis, generally at least once per
year. Additionally, no less frequently than on an annual basis,
we review PD rates related to each rating grade based upon
internal historical data. These rates are updated as needed and
augmented by market data as deemed necessary. For small
balance homogenous pools of commercial loans, mortgages
and leases, we apply statistical modeling to assist in
determining the probability of default within these pools.
Further, on a periodic basis, we update our LGD estimates
associated with each rating grade based upon historical data.
The combination of the PD and LGD ratings assigned to a
commercial loan, capturing both the combination of
expectations of default and loss severity in event of default,
reflects the relative estimated likelihood of loss for that loan at
the reporting date. In general, loans with better PD and LGD
tend to have a lower likelihood of loss compared to loans with
worse PD and LGD. The loss amount also considers exposure
at date of default, which we also periodically update based
upon historical data.
Based upon the amount of the lending arrangement and our
risk rating assessment, we follow a formal schedule of written
periodic review. Quarterly, we conduct formal reviews of a
market’s or business unit’s entire loan portfolio, focusing on
those loans which we perceive to be of higher risk, based upon
PDs and LGDs, or loans for which credit quality is weakening.
If circumstances warrant, it is our practice to review any
customer obligation and its level of credit risk more
frequently. We attempt to proactively manage our loans by
using various procedures that are customized to the risk of a
given loan, including ongoing outreach, contact, and
assessment of obligor financial conditions, collateral
inspection and appraisal.
The PNC Financial Services Group, Inc. – Form 10-K 131