PNC Bank 2014 Annual Report Download - page 153
Download and view the complete annual report
Please find page 153 of the 2014 PNC Bank annual report below. You can navigate through the pages in the report by either clicking on the pages listed below, or by using the keyword search tool below to find specific information within the annual report.-
 1
1 -
2
-
3
-
4
-
5
-
6
-
7
-
8
-
9
-
10
-
11
-
12
-
13
-
14
-
15
-
16
-
17
-
18
-
19
-
20
-
21
-
22
-
23
-
24
-
25
-
26
-
27
-
28
-
29
-
30
-
31
-
32
-
33
-
34
-
35
-
36
-
37
-
38
-
39
-
40
-
41
-
42
-
43
-
44
-
45
-
46
-
47
-
48
-
49
-
50
-
51
-
52
-
53
-
54
-
55
-
56
-
57
-
58
-
59
-
60
-
61
-
62
-
63
-
64
-
65
-
66
-
67
-
68
-
69
-
70
-
71
-
72
-
73
-
74
-
75
-
76
-
77
-
78
-
79
-
80
-
81
-
82
-
83
-
84
-
85
-
86
-
87
-
88
-
89
-
90
-
91
-
92
-
93
-
94
-
95
-
96
-
97
-
98
-
99
-
100
-
101
-
102
-
103
-
104
-
105
-
106
-
107
-
108
-
109
-
110
-
111
-
112
-
113
-
114
-
115
-
116
-
117
-
118
-
119
-
120
-
121
-
122
-
123
-
124
-
125
-
126
-
127
-
128
-
129
-
130
-
131
-
132
-
133
-
134
-
135
-
136
-
137
-
138
-
139
-
140
-
141
-
142
-
 143
143 -
 144
144 -
 145
145 -
 146
146 -
 147
147 -
 148
148 -
 149
149 -
 150
150 -
 151
151 -
 152
152 -
 153
153 -
 154
154 -
 155
155 -
 156
156 -
 157
157 -
 158
158 -
 159
159 -
 160
160 -
 161
161 -
 162
162 -
 163
163 -
164
-
165
-
166
-
167
-
168
-
169
-
170
-
171
-
172
-
173
-
174
-
175
-
176
-
177
-
178
-
179
-
180
-
181
-
182
-
183
-
184
-
185
-
186
-
187
-
188
-
189
-
190
-
191
-
192
-
193
-
194
-
195
-
196
-
197
-
198
-
199
-
200
-
201
-
202
-
203
-
204
-
205
-
206
-
207
-
208
-
209
-
210
-
211
-
212
-
213
-
214
-
215
-
216
-
217
-
218
-
219
-
220
-
221
-
222
-
223
-
224
-
225
-
226
-
227
-
228
-
229
-
230
-
231
-
232
-
233
-
234
-
235
-
236
-
237
-
238
-
239
-
240
-
241
-
242
-
243
-
244
-
245
-
246
-
247
-
248
-
249
-
250
-
251
-
252
-
253
-
254
-
255
-
256
-
257
-
258
-
259
-
260
-
261
-
262
-
263
-
264
-
265
-
266
-
267
-
268
 |
 |

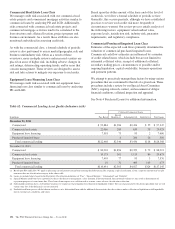
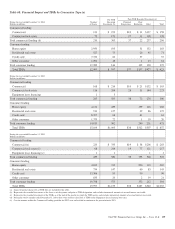
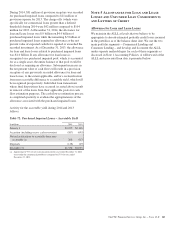
Accordingly, the results of these calculations do not represent actual appraised loan level collateral or updated LTV based upon a current first lien balance, and as such, are necessarily
imprecise and subject to change as we enhance our methodology.
(d) Higher risk loans are defined as loans with both an updated FICO score of less than or equal to 660 and an updated LTV greater than or equal to 100%.
(e) The following states had the highest percentage of higher risk loans at December 31, 2014: New Jersey 14%, Pennsylvania 12%, Illinois 12%, Ohio 12%, Florida 8%, Maryland 6%,
Michigan 5% and North Carolina 4%. The remainder of the states had lower than 4% of the higher risk loans individually, and collectively they represent approximately 28% of the
higher risk loans. The following states had the highest percentage of higher risk loans at December 31, 2013: New Jersey 13%, Illinois 12%, Pennsylvania 12%, Ohio 11%, Florida
9%, Maryland 5%, Michigan 5%, and California 4%. The remainder of the states had lower than 4% of the high risk loans individually, and collectively they represent approximately
29% of the higher risk loans.
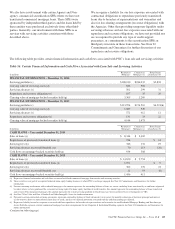
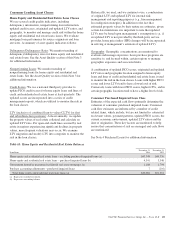
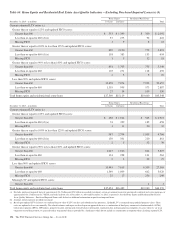
Table 65: Home Equity and Residential Real Estate Asset Quality Indicators – Purchased Impaired Loans (a)
Home Equity (b) (c) Residential Real Estate (b) (c)
TotalDecember 31, 2014 – in millions 1st Liens 2nd Liens
Current estimated LTV ratios (d)
Greater than or equal to 125% and updated FICO scores:
Greater than 660 $ 8 $ 243 $ 276 $ 527
Less than or equal to 660 9 125 144 278
Missing FICO 8614
Greater than or equal to 100% to less than 125% and updated FICO scores:
Greater than 660 15 426 272 713
Less than or equal to 660 12 194 200 406
Missing FICO 11 5 16
Greater than or equal to 90% to less than 100% and updated FICO scores:
Greater than 660 12 207 186 405
Less than or equal to 660 9 93 123 225
Missing FICO 538
Less than 90% and updated FICO scores:
Greater than 660 102 339 626 1,067
Less than or equal to 660 109 200 515 824
Missing FICO 1 12 15 28
Missing LTV and updated FICO scores:
Greater than 660 1 14 15
Less than or equal to 660 4 10 14
Missing FICO 11
Total home equity and residential real estate loans $282 $1,863 $2,396 $4,541
The PNC Financial Services Group, Inc. – Form 10-K 135