PNC Bank 2014 Annual Report Download - page 163
Download and view the complete annual report
Please find page 163 of the 2014 PNC Bank annual report below. You can navigate through the pages in the report by either clicking on the pages listed below, or by using the keyword search tool below to find specific information within the annual report.-
 1
1 -
2
-
3
-
4
-
5
-
6
-
7
-
8
-
9
-
10
-
11
-
12
-
13
-
14
-
15
-
16
-
17
-
18
-
19
-
20
-
21
-
22
-
23
-
24
-
25
-
26
-
27
-
28
-
29
-
30
-
31
-
32
-
33
-
34
-
35
-
36
-
37
-
38
-
39
-
40
-
41
-
42
-
43
-
44
-
45
-
46
-
47
-
48
-
49
-
50
-
51
-
52
-
53
-
54
-
55
-
56
-
57
-
58
-
59
-
60
-
61
-
62
-
63
-
64
-
65
-
66
-
67
-
68
-
69
-
70
-
71
-
72
-
73
-
74
-
75
-
76
-
77
-
78
-
79
-
80
-
81
-
82
-
83
-
84
-
85
-
86
-
87
-
88
-
89
-
90
-
91
-
92
-
93
-
94
-
95
-
96
-
97
-
98
-
99
-
100
-
101
-
102
-
103
-
104
-
105
-
106
-
107
-
108
-
109
-
110
-
111
-
112
-
113
-
114
-
115
-
116
-
117
-
118
-
119
-
120
-
121
-
122
-
123
-
124
-
125
-
126
-
127
-
128
-
129
-
130
-
131
-
132
-
133
-
134
-
135
-
136
-
137
-
138
-
139
-
140
-
141
-
142
-
143
-
144
-
145
-
146
-
147
-
148
-
149
-
150
-
151
-
152
-
 153
153 -
 154
154 -
 155
155 -
 156
156 -
 157
157 -
 158
158 -
 159
159 -
 160
160 -
 161
161 -
 162
162 -
 163
163 -
 164
164 -
 165
165 -
 166
166 -
 167
167 -
 168
168 -
 169
169 -
 170
170 -
 171
171 -
 172
172 -
 173
173 -
174
-
175
-
176
-
177
-
178
-
179
-
180
-
181
-
182
-
183
-
184
-
185
-
186
-
187
-
188
-
189
-
190
-
191
-
192
-
193
-
194
-
195
-
196
-
197
-
198
-
199
-
200
-
201
-
202
-
203
-
204
-
205
-
206
-
207
-
208
-
209
-
210
-
211
-
212
-
213
-
214
-
215
-
216
-
217
-
218
-
219
-
220
-
221
-
222
-
223
-
224
-
225
-
226
-
227
-
228
-
229
-
230
-
231
-
232
-
233
-
234
-
235
-
236
-
237
-
238
-
239
-
240
-
241
-
242
-
243
-
244
-
245
-
246
-
247
-
248
-
249
-
250
-
251
-
252
-
253
-
254
-
255
-
256
-
257
-
258
-
259
-
260
-
261
-
262
-
263
-
264
-
265
-
266
-
267
-
268
 |
 |

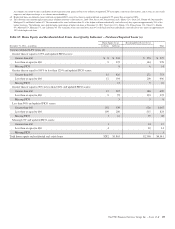
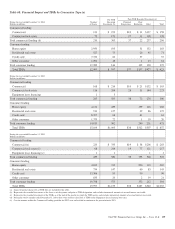
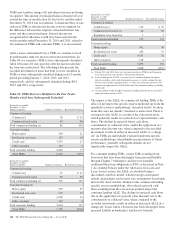
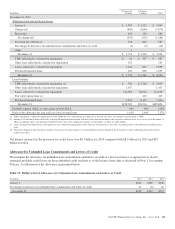
In millions
Commercial
Lending
Consumer
Lending Total
December 31, 2012
Allowance for Loan and Lease Losses
January 1 $ 1,995 $ 2,352 $ 4,347
Charge-offs (804) (1,066) (1,870)
Recoveries 445 136 581
Net charge-offs (359) (930) (1,289)
Provision for credit losses 138 849 987
Net change in allowance for unfunded loan commitments and letters of credit (1) (9) (10)
Other 11
December 31 $ 1,774 $ 2,262 $ 4,036
TDRs individually evaluated for impairment $ 40 $ 547 $ 587
Other loans individually evaluated for impairment 253 253
Loans collectively evaluated for impairment 1,242 857 2,099
Purchased impaired loans 239 858 1,097
December 31 $ 1,774 $ 2,262 $ 4,036
Loan Portfolio
TDRs individually evaluated for impairment (a) $ 541 $ 2,318 $ 2,859
Other loans individually evaluated for impairment 1,057 1,057
Loans collectively evaluated for impairment 106,095 68,014 174,109
Fair value option loans (c) 425 425
Purchased impaired loans 1,249 6,157 7,406
December 31 $108,942 $76,914 $185,856
Portfolio segment ALLL as a percentage of total ALLL 44% 56% 100%
Ratio of the allowance for loan and lease losses to total loans 1.63% 2.94% 2.17%
(a) TDRs individually evaluated for impairment exclude TDRs that were subsequently accounted for as held for sale loans, but continue to be disclosed as TDRs.
(b) Includes $195 million of loans collectively evaluated for impairment based upon collateral values and written down to the respective collateral value less costs to sell at December 31,
2014. Accordingly, there is no allowance recorded for these loans. The comparative amount as of December 31, 2013 was $252 million.
(c) Loans accounted for under the fair value option are not evaluated for impairment as these loans are accounted for at fair value. Accordingly there is no allowance recorded on these
loans.
(d) Pursuant to alignment with interagency guidance on practices for loans and lines of credit related to consumer lending in the first quarter of 2013, additional charge-offs of $134
million were taken.
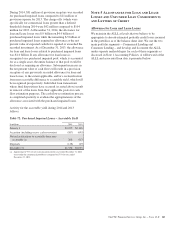
Net interest income less the provision for credit losses was $8.3 billion for 2014 compared with $8.5 billion for 2013 and $8.7
billion for 2012.
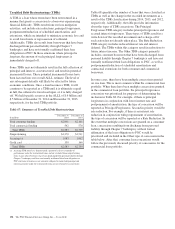
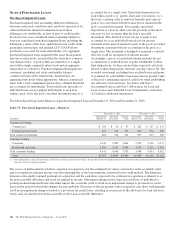
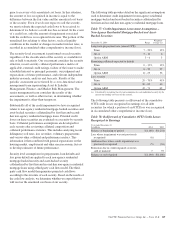
Allowance for Unfunded Loan Commitments and Letters of Credit
We maintain the allowance for unfunded loan commitments and letters of credit at a level we believe is appropriate to absorb
estimated probable credit losses on these unfunded credit facilities as of the balance sheet date as discussed in Note 1 Accounting
Policies. A rollforward of the allowance is presented below.
Table 74: Rollforward of Allowance for Unfunded Loan Commitments and Letters of Credit
In millions 2014 2013 2012
January 1 $242 $250 $240
Net change in allowance for unfunded loan commitments and letters of credit 17 (8) 10
December 31 $259 $242 $250
The PNC Financial Services Group, Inc. – Form 10-K 145