PNC Bank 2014 Annual Report Download - page 168
Download and view the complete annual report
Please find page 168 of the 2014 PNC Bank annual report below. You can navigate through the pages in the report by either clicking on the pages listed below, or by using the keyword search tool below to find specific information within the annual report.-
 1
1 -
2
-
3
-
4
-
5
-
6
-
7
-
8
-
9
-
10
-
11
-
12
-
13
-
14
-
15
-
16
-
17
-
18
-
19
-
20
-
21
-
22
-
23
-
24
-
25
-
26
-
27
-
28
-
29
-
30
-
31
-
32
-
33
-
34
-
35
-
36
-
37
-
38
-
39
-
40
-
41
-
42
-
43
-
44
-
45
-
46
-
47
-
48
-
49
-
50
-
51
-
52
-
53
-
54
-
55
-
56
-
57
-
58
-
59
-
60
-
61
-
62
-
63
-
64
-
65
-
66
-
67
-
68
-
69
-
70
-
71
-
72
-
73
-
74
-
75
-
76
-
77
-
78
-
79
-
80
-
81
-
82
-
83
-
84
-
85
-
86
-
87
-
88
-
89
-
90
-
91
-
92
-
93
-
94
-
95
-
96
-
97
-
98
-
99
-
100
-
101
-
102
-
103
-
104
-
105
-
106
-
107
-
108
-
109
-
110
-
111
-
112
-
113
-
114
-
115
-
116
-
117
-
118
-
119
-
120
-
121
-
122
-
123
-
124
-
125
-
126
-
127
-
128
-
129
-
130
-
131
-
132
-
133
-
134
-
135
-
136
-
137
-
138
-
139
-
140
-
141
-
142
-
143
-
144
-
145
-
146
-
147
-
148
-
149
-
150
-
151
-
152
-
153
-
154
-
155
-
156
-
157
-
 158
158 -
 159
159 -
 160
160 -
 161
161 -
 162
162 -
 163
163 -
 164
164 -
 165
165 -
 166
166 -
 167
167 -
 168
168 -
 169
169 -
 170
170 -
 171
171 -
 172
172 -
 173
173 -
 174
174 -
 175
175 -
 176
176 -
 177
177 -
 178
178 -
179
-
180
-
181
-
182
-
183
-
184
-
185
-
186
-
187
-
188
-
189
-
190
-
191
-
192
-
193
-
194
-
195
-
196
-
197
-
198
-
199
-
200
-
201
-
202
-
203
-
204
-
205
-
206
-
207
-
208
-
209
-
210
-
211
-
212
-
213
-
214
-
215
-
216
-
217
-
218
-
219
-
220
-
221
-
222
-
223
-
224
-
225
-
226
-
227
-
228
-
229
-
230
-
231
-
232
-
233
-
234
-
235
-
236
-
237
-
238
-
239
-
240
-
241
-
242
-
243
-
244
-
245
-
246
-
247
-
248
-
249
-
250
-
251
-
252
-
253
-
254
-
255
-
256
-
257
-
258
-
259
-
260
-
261
-
262
-
263
-
264
-
265
-
266
-
267
-
268
 |
 |

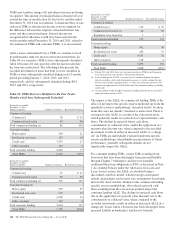
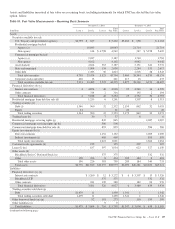
Information relating to gross realized securities gains and losses from the sales of securities is set forth in the following table.
Table 79: Gains (Losses) on Sales of Securities Available for Sale
In millions Proceeds
Gross
Gains
Gross
Losses
Net
Gains
Tax
Expense
For the year ended December 31
2014 $4,480 $ 33 $(29) $ 4 $ 1
2013 8,178 146 (47) 99 35
2012 9,441 214 (10) 204 71
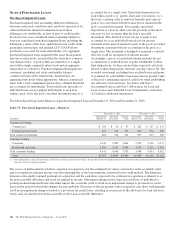
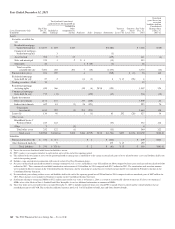
The following table presents, by remaining contractual maturity, the amortized cost, fair value and weighted-average yield of debt
securities at December 31, 2014.
Table 80: Contractual Maturity of Debt Securities
December 31, 2014
Dollars in millions
1 Year or
Less
After 1 Year
through 5
Years
After 5 Years
through 10 Years
After 10
Years Total
S
ECURITIES
A
VAILABLE FOR
S
ALE
U.S. Treasury and government agencies $ 2 $1,312 $3,437 $ 486 $ 5,237
Residential mortgage-backed
Agency 120 456 17,070 17,646
Non-agency 6 1 4,716 4,723
Commercial mortgage-backed
Agency 128 206 20 1,824 2,178
Non-agency 50 4,035 4,085
Asset-backed 4 1,014 1,977 2,146 5,141
State and municipal 5 134 324 1,490 1,953
Other debt 91 1,045 437 203 1,776
Total debt securities available for sale $ 230 $3,887 $6,652 $31,970 $42,739
Fair value $ 231 $3,976 $6,760 $32,827 $43,794
Weighted-average yield, GAAP basis 3.49% 2.55% 2.36% 2.99% 2.85%
S
ECURITIES
H
ELD TO
M
ATURITY
U.S. Treasury and government agencies $ 248 $ 248
Residential mortgage-backed
Agency 5,736 5,736
Non-agency 270 270
Commercial mortgage-backed
Agency $ 996 $ 145 59 1,200
Non-agency 6 1,004 1,010
Asset-backed 17 408 334 759
State and municipal $ 20 26 809 1,187 2,042
Other debt 323 323
Total debt securities held to maturity $ 20 $1,045 $1,685 $ 8,838 $11,588
Fair value $ 20 $1,085 $1,751 $ 9,128 $11,984
Weighted-average yield, GAAP basis 4.42% 3.44% 3.29% 3.72% 3.63%
150 The PNC Financial Services Group, Inc. – Form 10-K