PNC Bank 2014 Annual Report Download - page 147
Download and view the complete annual report
Please find page 147 of the 2014 PNC Bank annual report below. You can navigate through the pages in the report by either clicking on the pages listed below, or by using the keyword search tool below to find specific information within the annual report.-
 1
1 -
2
-
3
-
4
-
5
-
6
-
7
-
8
-
9
-
10
-
11
-
12
-
13
-
14
-
15
-
16
-
17
-
18
-
19
-
20
-
21
-
22
-
23
-
24
-
25
-
26
-
27
-
28
-
29
-
30
-
31
-
32
-
33
-
34
-
35
-
36
-
37
-
38
-
39
-
40
-
41
-
42
-
43
-
44
-
45
-
46
-
47
-
48
-
49
-
50
-
51
-
52
-
53
-
54
-
55
-
56
-
57
-
58
-
59
-
60
-
61
-
62
-
63
-
64
-
65
-
66
-
67
-
68
-
69
-
70
-
71
-
72
-
73
-
74
-
75
-
76
-
77
-
78
-
79
-
80
-
81
-
82
-
83
-
84
-
85
-
86
-
87
-
88
-
89
-
90
-
91
-
92
-
93
-
94
-
95
-
96
-
97
-
98
-
99
-
100
-
101
-
102
-
103
-
104
-
105
-
106
-
107
-
108
-
109
-
110
-
111
-
112
-
113
-
114
-
115
-
116
-
117
-
118
-
119
-
120
-
121
-
122
-
123
-
124
-
125
-
126
-
127
-
128
-
129
-
130
-
131
-
132
-
133
-
134
-
135
-
136
-
 137
137 -
 138
138 -
 139
139 -
 140
140 -
 141
141 -
 142
142 -
 143
143 -
 144
144 -
 145
145 -
 146
146 -
 147
147 -
 148
148 -
 149
149 -
 150
150 -
 151
151 -
 152
152 -
 153
153 -
 154
154 -
 155
155 -
 156
156 -
 157
157 -
158
-
159
-
160
-
161
-
162
-
163
-
164
-
165
-
166
-
167
-
168
-
169
-
170
-
171
-
172
-
173
-
174
-
175
-
176
-
177
-
178
-
179
-
180
-
181
-
182
-
183
-
184
-
185
-
186
-
187
-
188
-
189
-
190
-
191
-
192
-
193
-
194
-
195
-
196
-
197
-
198
-
199
-
200
-
201
-
202
-
203
-
204
-
205
-
206
-
207
-
208
-
209
-
210
-
211
-
212
-
213
-
214
-
215
-
216
-
217
-
218
-
219
-
220
-
221
-
222
-
223
-
224
-
225
-
226
-
227
-
228
-
229
-
230
-
231
-
232
-
233
-
234
-
235
-
236
-
237
-
238
-
239
-
240
-
241
-
242
-
243
-
244
-
245
-
246
-
247
-
248
-
249
-
250
-
251
-
252
-
253
-
254
-
255
-
256
-
257
-
258
-
259
-
260
-
261
-
262
-
263
-
264
-
265
-
266
-
267
-
268
 |
 |
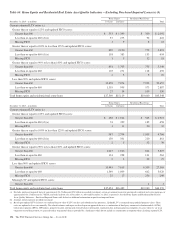
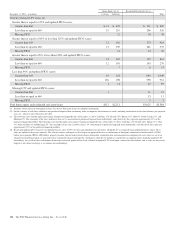
accounted for at amortized cost whose credit quality has deteriorated to the extent that full collection of contractual principal and
interest is not probable. Interest income is not recognized on these loans. Loans accounted for under the fair value option are
reported as performing loans as these loans are accounted for at fair value. However, when nonaccrual criteria is met, interest
income is not recognized on these loans. Additionally, certain government insured or guaranteed loans for which we expect to
collect substantially all principal and interest are not reported as nonperforming loans and continue to accrue interest. Purchased
impaired loans are excluded from nonperforming loans as we are currently accreting interest income over the expected life of the
loans. See Note 4 Purchased Loans for further information.
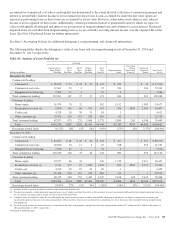
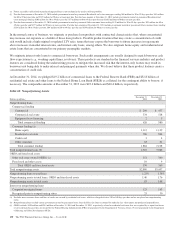
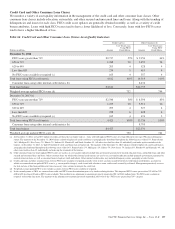
See Note 1 Accounting Policies for additional delinquency, nonperforming, and charge-off information.
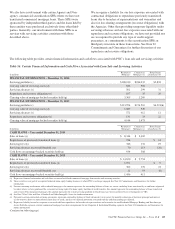
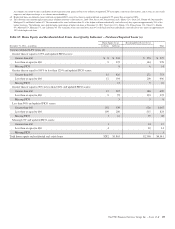
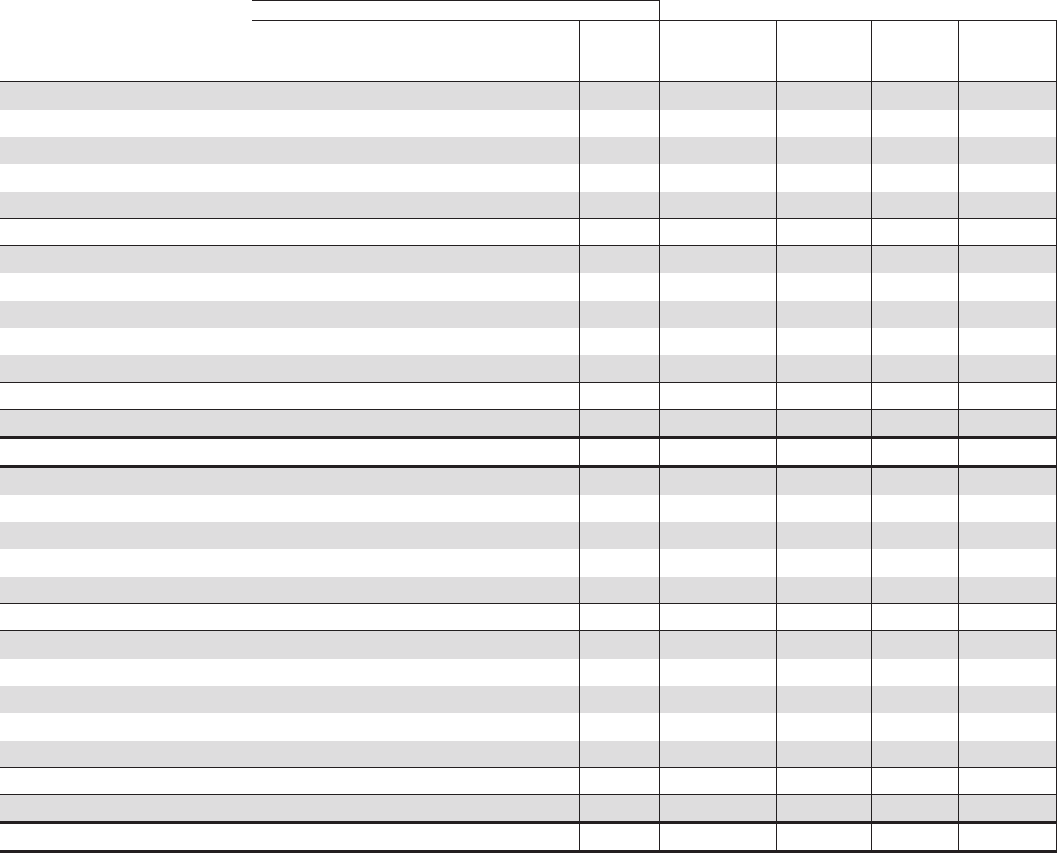
The following tables display the delinquency status of our loans and our nonperforming assets at December 31, 2014 and
December 31, 2013, respectively.
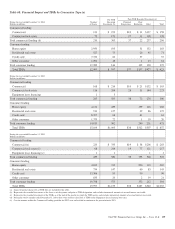
Table 60: Analysis of Loan Portfolio (a)
Accruing
Dollars in millions
Current or Less
Than 30 Days
Past Due
30-59
Days
Past Due
60-89
Days
Past Due
90 Days
Or More
Past Due
Total
Past
Due (b)
Nonperforming
Loans
Fair Value
Option
Nonaccrual
Loans (c)
Purchased
Impaired
Loans
Total Loans
(d) (e)
December 31, 2014
Commercial Lending
Commercial $ 96,922 $ 73 $ 24 $ 37 $ 134 $ 290 $ 74 $ 97,420
Commercial real estate 22,667 23 2 25 334 236 23,262
Equipment lease financing 7,672 11 1 12 2 7,686
Total commercial lending 127,261 107 27 37 171 626 310 128,368
Consumer Lending
Home equity 31,474 70 32 102 1,112 1,989 34,677
Residential real estate (f) 9,900 163 68 742 973 706 $269 2,559 14,407
Credit card 4,528 28 20 33 81 3 4,612
Other consumer (g) 22,071 214 112 293 619 63 22,753
Total consumer lending 67,973 475 232 1,068 1,775 1,884 269 4,548 76,449
Total $195,234 $582 $259 $1,105 $1,946 $2,510 $269 $4,858 $204,817
Percentage of total loans 95.32% .28% .13% .54% 0.95% 1.23% .13% 2.37% 100.00%
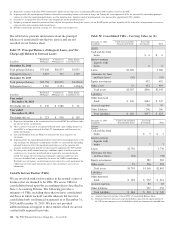
December 31, 2013
Commercial Lending
Commercial $ 87,621 $ 81 $ 20 $ 42 $ 143 $ 457 $ 157 $ 88,378
Commercial real estate 20,090 54 11 2 67 518 516 21,191
Equipment lease financing 7,538 31 2 33 5 7,576
Total commercial lending 115,249 166 33 44 243 980 673 117,145
Consumer Lending
Home equity 32,877 86 34 120 1,139 2,311 36,447
Residential real estate (f) 9,311 217 87 1,060 1,364 904 $365 3,121 15,065
Credit card 4,339 29 19 34 82 4 4,425
Other consumer (g) 21,788 216 112 353 681 61 1 22,531
Total consumer lending 68,315 548 252 1,447 2,247 2,108 365 5,433 78,468
Total $183,564 $714 $285 $1,491 $2,490 $3,088 $365 $6,106 $195,613
Percentage of total loans 93.83% .37% .15% .76% 1.28% 1.58% .19% 3.12% 100.00%
(a) Amounts in table represent recorded investment and exclude loans held for sale.
(b) Past due loan amounts exclude purchased impaired loans, even if contractually past due (or if we do not expect to receive payment in full based on the original contractual terms), as
we are currently accreting interest income over the expected life of the loans.
(c) Consumer loans accounted for under the fair value option for which we do not expect to collect substantially all principal and interest are subject to nonaccrual accounting and
classification upon meeting any of our nonaccrual policies. Given that these loans are not accounted for at amortized cost, these loans have been excluded from the nonperforming
loan population.
(d) Net of unearned income, net deferred loan fees, unamortized discounts and premiums, and purchase discounts and premiums totaling $1.7 billion and $2.1 billion at December 31,
2014 and December 31, 2013, respectively.
(Continued on following page)
The PNC Financial Services Group, Inc. – Form 10-K 129