PNC Bank 2014 Annual Report Download - page 55
Download and view the complete annual report
Please find page 55 of the 2014 PNC Bank annual report below. You can navigate through the pages in the report by either clicking on the pages listed below, or by using the keyword search tool below to find specific information within the annual report.-
 1
1 -
2
-
3
-
4
-
5
-
6
-
7
-
8
-
9
-
10
-
11
-
12
-
13
-
14
-
15
-
16
-
17
-
18
-
19
-
20
-
21
-
22
-
23
-
24
-
25
-
26
-
27
-
28
-
29
-
30
-
31
-
32
-
33
-
34
-
35
-
36
-
37
-
38
-
39
-
40
-
41
-
42
-
43
-
44
-
 45
45 -
 46
46 -
 47
47 -
 48
48 -
 49
49 -
 50
50 -
 51
51 -
 52
52 -
 53
53 -
 54
54 -
 55
55 -
 56
56 -
 57
57 -
 58
58 -
 59
59 -
 60
60 -
 61
61 -
 62
62 -
 63
63 -
 64
64 -
 65
65 -
66
-
67
-
68
-
69
-
70
-
71
-
72
-
73
-
74
-
75
-
76
-
77
-
78
-
79
-
80
-
81
-
82
-
83
-
84
-
85
-
86
-
87
-
88
-
89
-
90
-
91
-
92
-
93
-
94
-
95
-
96
-
97
-
98
-
99
-
100
-
101
-
102
-
103
-
104
-
105
-
106
-
107
-
108
-
109
-
110
-
111
-
112
-
113
-
114
-
115
-
116
-
117
-
118
-
119
-
120
-
121
-
122
-
123
-
124
-
125
-
126
-
127
-
128
-
129
-
130
-
131
-
132
-
133
-
134
-
135
-
136
-
137
-
138
-
139
-
140
-
141
-
142
-
143
-
144
-
145
-
146
-
147
-
148
-
149
-
150
-
151
-
152
-
153
-
154
-
155
-
156
-
157
-
158
-
159
-
160
-
161
-
162
-
163
-
164
-
165
-
166
-
167
-
168
-
169
-
170
-
171
-
172
-
173
-
174
-
175
-
176
-
177
-
178
-
179
-
180
-
181
-
182
-
183
-
184
-
185
-
186
-
187
-
188
-
189
-
190
-
191
-
192
-
193
-
194
-
195
-
196
-
197
-
198
-
199
-
200
-
201
-
202
-
203
-
204
-
205
-
206
-
207
-
208
-
209
-
210
-
211
-
212
-
213
-
214
-
215
-
216
-
217
-
218
-
219
-
220
-
221
-
222
-
223
-
224
-
225
-
226
-
227
-
228
-
229
-
230
-
231
-
232
-
233
-
234
-
235
-
236
-
237
-
238
-
239
-
240
-
241
-
242
-
243
-
244
-
245
-
246
-
247
-
248
-
249
-
250
-
251
-
252
-
253
-
254
-
255
-
256
-
257
-
258
-
259
-
260
-
261
-
262
-
263
-
264
-
265
-
266
-
267
-
268
 |
 |

C
ONSOLIDATED
I
NCOME
S
TATEMENT
R
EVIEW
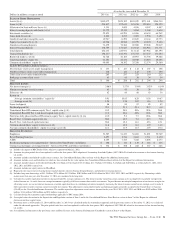
Our Consolidated Income Statement is presented in Item 8 of
this Report.
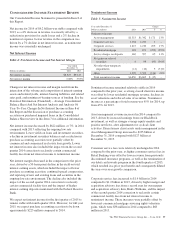
Net income for 2014 of $4.2 billion was stable compared with
2013, as a 4% decrease in revenue was mostly offset by a
reduction in provision for credit losses and a 2% decline in
noninterest expense. Lower revenue in the comparison was
driven by a 7% decline in net interest income, as noninterest
income was essentially unchanged.
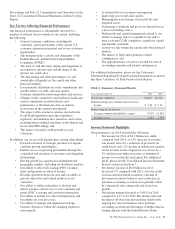
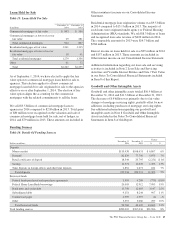
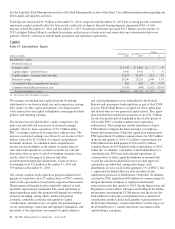
Net Interest Income
Table 4: Net Interest Income and Net Interest Margin
Year ended
December 31
Dollars in millions 2014 2013
Net interest income $8,525 $9,147
Net interest margin 3.08% 3.57%
Changes in net interest income and margin result from the
interaction of the volume and composition of interest-earning
assets and related yields, interest-bearing liabilities and related
rates paid, and noninterest-bearing sources of funding. See the
Statistical Information (Unaudited) – Average Consolidated
Balance Sheet And Net Interest Analysis and Analysis Of
Year-To-Year Changes In Net Interest Income in Item 8 of
this Report and the discussion of purchase accounting
accretion on purchased impaired loans in the Consolidated
Balance Sheet review in this Item 7 for additional information.
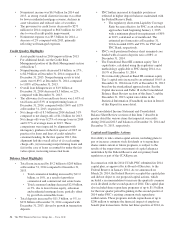
Net interest income decreased by $622 million, or 7%, in 2014
compared with 2013 reflecting the ongoing low rate
environment. Lower yields on loans and investment securities,
a decline in investment securities balances and a reduction in
purchase accounting accretion were partially offset by
commercial and commercial real estate loan growth. Lower
net interest income also included the impact from the second
quarter 2014 correction to reclassify certain commercial
facility fees from net interest income to noninterest income.
Net interest margin decreased in the comparison to the prior
year, driven by a 50 basis point decline in the yield on total
interest-earning assets, which included the impact of lower
purchase accounting accretion, continued spread compression,
and repricing of new and existing loans and securities in the
ongoing low rate environment. The decline also included the
impact of the second quarter 2014 correction to reclassify
certain commercial facility fees and the impact of higher
interest-earning deposits maintained with the Federal Reserve
Bank.
We expect net interest income for the first quarter of 2015 to
remain stable with fourth quarter 2014. However, for full year
2015, we expect purchase accounting accretion to be down
approximately $225 million compared to 2014.
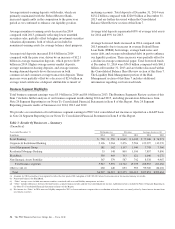
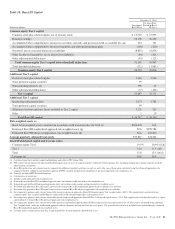
Noninterest Income
Table 5: Noninterest Income
Year ended December 31 Change
Dollars in millions 2014 2013 $ %
Noninterest income
Asset management $1,513 $1,342 $ 171 13%
Consumer services 1,254 1,253 1 –
Corporate services 1,415 1,210 205 17%
Residential mortgage 618 871 (253) (29)%
Service charges on deposits 662 597 65 11%
Net gains on sales of
securities 4 99 (95) (96)%
Net other-than-temporary
impairments (11) (16) 5 (31)%
Other 1,395 1,509 (114) (8)%
Total noninterest income $6,850 $6,865 $ (15) –
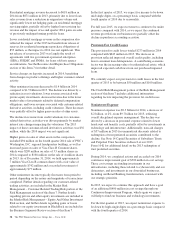
Noninterest income remained relatively stable in 2014
compared to the prior year, as strong overall client fee income
was offset by lower residential mortgage revenue, declines in
asset valuations and reduced sales of securities. Noninterest
income as a percentage of total revenue was 45% for 2014, up
from 43% for 2013.
Asset management revenue increased in 2014 compared to
2013, driven by increased earnings from our BlackRock
investment, as well as stronger average equity markets and
positive net flows, after adjustments for cyclical client
activities. Discretionary client assets under management in the
Asset Management Group increased to $135 billion at
December 31, 2014 compared with $127 billion at
December 31, 2013.
Consumer service fees were relatively unchanged in 2014
compared to the prior year, as higher consumer service fees in
Retail Banking were offset by lower revenue from previously
discontinued insurance programs, as well as the termination of
our debit card rewards program in the fourth quarter of 2013,
which resulted in a prior year benefit and consequently diluted
the year-over-year growth comparison.
Corporate service fees increased to $1.4 billion in 2014
compared to $1.2 billion in 2013, driven by higher merger and
acquisition advisory fees from a record year for our mergers
and acquisition advisory firm, Harris Williams, and the impact
of the second quarter 2014 correction to reclassify certain
commercial facility fees from net interest income to
noninterest income. These increases were partially offset by
lower net commercial mortgage servicing rights valuation
gains, which were $38 million in 2014 compared to $68
million in 2013.
The PNC Financial Services Group, Inc. – Form 10-K 37