PNC Bank 2014 Annual Report Download - page 245
Download and view the complete annual report
Please find page 245 of the 2014 PNC Bank annual report below. You can navigate through the pages in the report by either clicking on the pages listed below, or by using the keyword search tool below to find specific information within the annual report.-
 1
1 -
2
-
3
-
4
-
5
-
6
-
7
-
8
-
9
-
10
-
11
-
12
-
13
-
14
-
15
-
16
-
17
-
18
-
19
-
20
-
21
-
22
-
23
-
24
-
25
-
26
-
27
-
28
-
29
-
30
-
31
-
32
-
33
-
34
-
35
-
36
-
37
-
38
-
39
-
40
-
41
-
42
-
43
-
44
-
45
-
46
-
47
-
48
-
49
-
50
-
51
-
52
-
53
-
54
-
55
-
56
-
57
-
58
-
59
-
60
-
61
-
62
-
63
-
64
-
65
-
66
-
67
-
68
-
69
-
70
-
71
-
72
-
73
-
74
-
75
-
76
-
77
-
78
-
79
-
80
-
81
-
82
-
83
-
84
-
85
-
86
-
87
-
88
-
89
-
90
-
91
-
92
-
93
-
94
-
95
-
96
-
97
-
98
-
99
-
100
-
101
-
102
-
103
-
104
-
105
-
106
-
107
-
108
-
109
-
110
-
111
-
112
-
113
-
114
-
115
-
116
-
117
-
118
-
119
-
120
-
121
-
122
-
123
-
124
-
125
-
126
-
127
-
128
-
129
-
130
-
131
-
132
-
133
-
134
-
135
-
136
-
137
-
138
-
139
-
140
-
141
-
142
-
143
-
144
-
145
-
146
-
147
-
148
-
149
-
150
-
151
-
152
-
153
-
154
-
155
-
156
-
157
-
158
-
159
-
160
-
161
-
162
-
163
-
164
-
165
-
166
-
167
-
168
-
169
-
170
-
171
-
172
-
173
-
174
-
175
-
176
-
177
-
178
-
179
-
180
-
181
-
182
-
183
-
184
-
185
-
186
-
187
-
188
-
189
-
190
-
191
-
192
-
193
-
194
-
195
-
196
-
197
-
198
-
199
-
200
-
201
-
202
-
203
-
204
-
205
-
206
-
207
-
208
-
209
-
210
-
211
-
212
-
213
-
214
-
215
-
216
-
217
-
218
-
219
-
220
-
221
-
222
-
223
-
224
-
225
-
226
-
227
-
228
-
229
-
230
-
231
-
232
-
233
-
234
-
 235
235 -
 236
236 -
 237
237 -
 238
238 -
 239
239 -
 240
240 -
 241
241 -
 242
242 -
 243
243 -
 244
244 -
 245
245 -
 246
246 -
 247
247 -
 248
248 -
 249
249 -
 250
250 -
 251
251 -
 252
252 -
 253
253 -
 254
254 -
 255
255 -
256
-
257
-
258
-
259
-
260
-
261
-
262
-
263
-
264
-
265
-
266
-
267
-
268
 |
 |

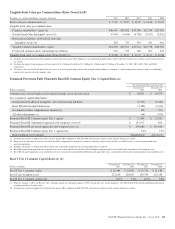
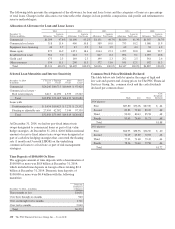
Tangible Book Value per Common Share Ratio (Non-GAAP)
December 31 – dollars in millions, except per share data 2014 2013 2012 2011 2010
Book value per common share (a) $ 77.61 $ 72.07 $ 66.95 $ 61.44 $ 56.22
Tangible book value per common share
Common shareholders’ equity (a) $40,605 $38,392 $35,358 $32,374 $29,560
Goodwill and Other Intangible Assets (b) (9,595) (9,654) (9,798) (9,027) (9,052)
Deferred tax liabilities on Goodwill and Other
Intangible Assets (b) 320 333 354 431 461
Tangible common shareholders’ equity $31,330 $29,071 $25,914 $23,778 $20,969
Period-end common shares outstanding (in millions) 523 533 528 527 526
Tangible book value per common share (Non-GAAP) (c) $ 59.88 $ 54.57 $ 49.07 $ 45.13 $ 39.88
(a) Amounts for prior periods have been updated to reflect the first quarter 2014 adoption of Accounting Standards Update (ASU) 2014-01 related to investments in low income housing
tax credits.
(b) Excludes the impact from mortgage servicing rights of $1.4 billion, $1.6 billion, $1.1 billion, $1.1 billion and $1.7 billion at December 31, 2014, 2013, 2012, 2011 and 2010,
respectively.
(c) We believe this non-GAAP financial measure serves as a useful tool to help evaluate the strength and discipline of a company’s capital management strategies and as an additional
conservative measure of total company value.
Estimated Pro forma Fully Phased-In Basel III Common Equity Tier 1 Capital Ratio (a)
Pro forma Fully Phased-In Basel III
Dollars in millions
December 31
2013
December 31
2012
Common stock, related surplus and retained earnings, net of treasury stock $ 38,031 $ 34,579
Less regulatory capital adjustments:
Goodwill and disallowed intangibles, net of deferred tax liabilities (9,321) (9,445)
Basel III total threshold deductions (1,386) (2,330)
Accumulated other comprehensive income (b) 196 276
All other adjustments (c) (64) (579)
Estimated Basel III Common equity Tier 1 capital $ 27,456 $ 22,501
Estimated Basel III standardized approach risk-weighted assets (d) $ 291,977 N/A
Estimated Basel III advanced approaches risk-weighted assets (e) $ 290,080 $ 301,006
Estimated Basel III Common equity Tier 1 capital ratio 9.4% 7.5%
Risk-weighted assets utilized Standardized Advanced
(a) Amounts have not been updated to reflect the first quarter 2014 adoption of ASU 2014-01 related to investments in low income housing tax credits.
(b) Represents net adjustments related to accumulated other comprehensive income for securities currently and previously held as available for sale, as well as pension and other
postretirement plans.
(c) Includes adjustments as required based on whether the standardized approach or advanced approaches is utilized.
(d) Basel III standardized approach risk-weighted assets were estimated based on the Basel III standardized approach rules and include credit and market risk-weighted assets.
(e) Basel III advanced approaches risk-weighted assets were estimated based on the Basel III advanced approaches rules, and include credit, market and operational risk-weighted assets.
Basel I Tier 1 Common Capital Ratio (a) (b)
Dollars in millions
December 31
2013
December 31
2012
December 31
2011
December 31
2010
Basel I Tier 1 common capital $ 28,484 $ 24,951 $ 23,732 $ 21,188
Basel I risk-weighted assets 272,169 260,847 230,705 216,283
Basel I Tier 1 common capital ratio 10.5% 9.6% 10.3% 9.8%
(a) Effective January 1, 2014, the Basel I Tier 1 common capital ratio no longer applies to PNC (except for stress testing purposes). Our 2013 Form 10-K included additional information
regarding our Basel I capital ratios.
(b) Amounts have not been updated to reflect the first quarter 2014 adoption of ASU 2014-01 related to investments in low income housing tax credits.
The PNC Financial Services Group, Inc. – Form 10-K 227