PNC Bank 2014 Annual Report Download - page 70
Download and view the complete annual report
Please find page 70 of the 2014 PNC Bank annual report below. You can navigate through the pages in the report by either clicking on the pages listed below, or by using the keyword search tool below to find specific information within the annual report.-
 1
1 -
2
-
3
-
4
-
5
-
6
-
7
-
8
-
9
-
10
-
11
-
12
-
13
-
14
-
15
-
16
-
17
-
18
-
19
-
20
-
21
-
22
-
23
-
24
-
25
-
26
-
27
-
28
-
29
-
30
-
31
-
32
-
33
-
34
-
35
-
36
-
37
-
38
-
39
-
40
-
41
-
42
-
43
-
44
-
45
-
46
-
47
-
48
-
49
-
50
-
51
-
52
-
53
-
54
-
55
-
56
-
57
-
58
-
59
-
 60
60 -
 61
61 -
 62
62 -
 63
63 -
 64
64 -
 65
65 -
 66
66 -
 67
67 -
 68
68 -
 69
69 -
 70
70 -
 71
71 -
 72
72 -
 73
73 -
 74
74 -
 75
75 -
 76
76 -
 77
77 -
 78
78 -
 79
79 -
 80
80 -
81
-
82
-
83
-
84
-
85
-
86
-
87
-
88
-
89
-
90
-
91
-
92
-
93
-
94
-
95
-
96
-
97
-
98
-
99
-
100
-
101
-
102
-
103
-
104
-
105
-
106
-
107
-
108
-
109
-
110
-
111
-
112
-
113
-
114
-
115
-
116
-
117
-
118
-
119
-
120
-
121
-
122
-
123
-
124
-
125
-
126
-
127
-
128
-
129
-
130
-
131
-
132
-
133
-
134
-
135
-
136
-
137
-
138
-
139
-
140
-
141
-
142
-
143
-
144
-
145
-
146
-
147
-
148
-
149
-
150
-
151
-
152
-
153
-
154
-
155
-
156
-
157
-
158
-
159
-
160
-
161
-
162
-
163
-
164
-
165
-
166
-
167
-
168
-
169
-
170
-
171
-
172
-
173
-
174
-
175
-
176
-
177
-
178
-
179
-
180
-
181
-
182
-
183
-
184
-
185
-
186
-
187
-
188
-
189
-
190
-
191
-
192
-
193
-
194
-
195
-
196
-
197
-
198
-
199
-
200
-
201
-
202
-
203
-
204
-
205
-
206
-
207
-
208
-
209
-
210
-
211
-
212
-
213
-
214
-
215
-
216
-
217
-
218
-
219
-
220
-
221
-
222
-
223
-
224
-
225
-
226
-
227
-
228
-
229
-
230
-
231
-
232
-
233
-
234
-
235
-
236
-
237
-
238
-
239
-
240
-
241
-
242
-
243
-
244
-
245
-
246
-
247
-
248
-
249
-
250
-
251
-
252
-
253
-
254
-
255
-
256
-
257
-
258
-
259
-
260
-
261
-
262
-
263
-
264
-
265
-
266
-
267
-
268
 |
 |
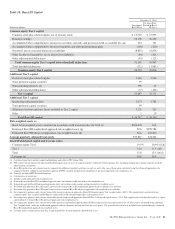
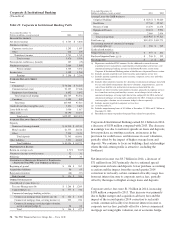
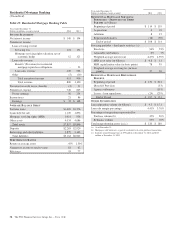
Retail Banking earned $728 million in 2014 compared with
earnings of $550 million in 2013. The increase in earnings
was driven by a lower provision for credit losses, and
increased noninterest income due to strong fee income growth.
These increases in earnings were partially offset by lower net
interest income driven by lower yields on loans, interest rate
spread compression on the value of deposits, and lower
purchase accounting accretion.
Retail Banking continues to augment and refine its core
checking account products to enhance the customer experience
and grow value. In 2014, we completed the conversion of
consumer and business banking customers from free checking.
We also focused on product value for consumers and small
businesses and growing customer share of wallet through the
sale of liquidity, banking and investment products.
• Completed the market rollout of PNC Total
InsightSM, an integrated online banking and investing
experience for our customers.
• Offered Apple PayTM to our customers as a
convenient payment option.
• Enhanced business banking Cash Flow InsightSM
features and customer experience.
• Introduced relationship pricing for business banking
customers.
Retail Banking also continued to focus on serving more
customers through cost effective channels that meet their
evolving preferences for convenience.
• In 2014, approximately 46% of consumer customers
used non-teller channels for the majority of their
transactions compared with 38% for 2013.
• Deposit transactions via ATM and mobile channels
increased to 35% of total deposit transactions in 2014
compared with 25% for 2013.
• As part of PNC’s retail branch transformation
strategy, we continue to evolve our network. We
converted 156 branches to universal branches in
2014; additional branches will be converted in 2015.
In 2014, 48 branches were closed or consolidated.
• Retail Banking’s primary geographic footprint
extends across 17 states and Washington, D.C. Our
retail branch network covers nearly half the U.S.
population, with 2,697 branches and 8,605 ATMs.
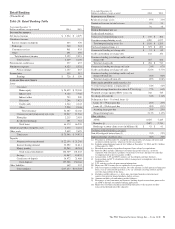
Total revenue declined $51 million to $6.0 billion in 2014. Net
interest income of $3.9 billion decreased $155 million compared
with 2013. The decrease resulted primarily from lower yields on
loans, interest rate spread compression on the value of deposits,
and lower purchase accounting accretion on loans and deposits.
Noninterest income of $2.1 billion increased $104 million, or 5%,
compared to 2013. Noninterest income included strong customer-
related fee income growth primarily resulting from changes in
product offerings, increases in customer-initiated transactions,
and increased brokerage and merchant processing revenue. Gains
on sales of Visa Class B common shares totaled $209 million in
2014 compared to $168 million in 2013; 3.5 million shares were
sold in 2014 compared to four million shares in 2013.
52 The PNC Financial Services Group, Inc. – Form 10-K