PNC Bank 2014 Annual Report Download - page 74
Download and view the complete annual report
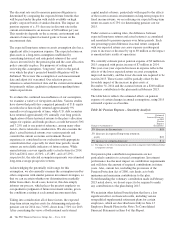
Please find page 74 of the 2014 PNC Bank annual report below. You can navigate through the pages in the report by either clicking on the pages listed below, or by using the keyword search tool below to find specific information within the annual report.-
 1
1 -
2
-
3
-
4
-
5
-
6
-
7
-
8
-
9
-
10
-
11
-
12
-
13
-
14
-
15
-
16
-
17
-
18
-
19
-
20
-
21
-
22
-
23
-
24
-
25
-
26
-
27
-
28
-
29
-
30
-
31
-
32
-
33
-
34
-
35
-
36
-
37
-
38
-
39
-
40
-
41
-
42
-
43
-
44
-
45
-
46
-
47
-
48
-
49
-
50
-
51
-
52
-
53
-
54
-
55
-
56
-
57
-
58
-
59
-
60
-
61
-
62
-
63
-
 64
64 -
 65
65 -
 66
66 -
 67
67 -
 68
68 -
 69
69 -
 70
70 -
 71
71 -
 72
72 -
 73
73 -
 74
74 -
 75
75 -
 76
76 -
 77
77 -
 78
78 -
 79
79 -
 80
80 -
 81
81 -
 82
82 -
 83
83 -
 84
84 -
85
-
86
-
87
-
88
-
89
-
90
-
91
-
92
-
93
-
94
-
95
-
96
-
97
-
98
-
99
-
100
-
101
-
102
-
103
-
104
-
105
-
106
-
107
-
108
-
109
-
110
-
111
-
112
-
113
-
114
-
115
-
116
-
117
-
118
-
119
-
120
-
121
-
122
-
123
-
124
-
125
-
126
-
127
-
128
-
129
-
130
-
131
-
132
-
133
-
134
-
135
-
136
-
137
-
138
-
139
-
140
-
141
-
142
-
143
-
144
-
145
-
146
-
147
-
148
-
149
-
150
-
151
-
152
-
153
-
154
-
155
-
156
-
157
-
158
-
159
-
160
-
161
-
162
-
163
-
164
-
165
-
166
-
167
-
168
-
169
-
170
-
171
-
172
-
173
-
174
-
175
-
176
-
177
-
178
-
179
-
180
-
181
-
182
-
183
-
184
-
185
-
186
-
187
-
188
-
189
-
190
-
191
-
192
-
193
-
194
-
195
-
196
-
197
-
198
-
199
-
200
-
201
-
202
-
203
-
204
-
205
-
206
-
207
-
208
-
209
-
210
-
211
-
212
-
213
-
214
-
215
-
216
-
217
-
218
-
219
-
220
-
221
-
222
-
223
-
224
-
225
-
226
-
227
-
228
-
229
-
230
-
231
-
232
-
233
-
234
-
235
-
236
-
237
-
238
-
239
-
240
-
241
-
242
-
243
-
244
-
245
-
246
-
247
-
248
-
249
-
250
-
251
-
252
-
253
-
254
-
255
-
256
-
257
-
258
-
259
-
260
-
261
-
262
-
263
-
264
-
265
-
266
-
267
-
268
 |
 |

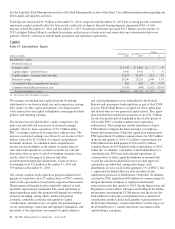
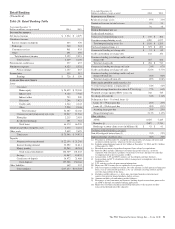
Asset Management Group
(Unaudited)
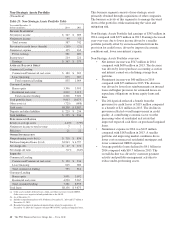
Table 22: Asset Management Group Table
Year ended December 31
Dollars in millions, except as noted 2014 2013
I
NCOME
S
TATEMENT
Net interest income $ 289 $ 288
Noninterest income 818 752
Total revenue 1,107 1,040
Provision for credit losses (benefit) (1) 10
Noninterest expense 821 774
Pretax earnings 287 256
Income taxes 106 94
Earnings $ 181 $ 162
A
VERAGE
B
ALANCE
S
HEET
Loans
Consumer $5,457 $5,025
Commercial and commercial real estate 986 1,047
Residential mortgage 809 776
Total loans 7,252 6,848
Goodwill and other intangible assets 259 293
Other assets 234 225
Total assets $7,745 $7,366
Deposits
Noninterest-bearing demand $1,366 $1,311
Interest-bearing demand 3,954 3,491
Money market 3,944 3,754
Total transaction deposits 9,264 8,556
CDs/IRAs/savings deposits 454 438
Total deposits 9,718 8,994
Other liabilities 51 60
Total liabilities $9,769 $9,054
P
ERFORMANCE
R
ATIOS
Return on average assets 2.34% 2.20%
Noninterest income to total revenue 74 72
Efficiency 74 74
O
THER
I
NFORMATION
Total nonperforming assets (a) (b) $ 66 $ 75
Purchased impaired loans (a) (c) $ 83 $ 99
Total net charge-offs $ 3 $ 1
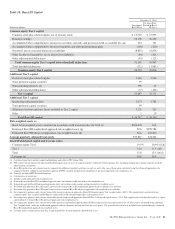
Year ended December 31
Dollars in millions, except as noted 2014 2013
C
LIENT
A
SSETS
U
NDER
A
DMINISTRATION
(in billions) (a) (d)
Personal $ 115 $ 111
Institutional 148 136
Total $ 263 $ 247
Asset Type
Equity $ 151 $ 142
Fixed Income 72 70
Liquidity/Other 40 35
Total $ 263 $ 247
Discretionary client assets under management
Personal $ 87 $ 83
Institutional 48 44
Total $ 135 $ 127
Asset Type
Equity $ 75 $ 70
Fixed Income 40 39
Liquidity/Other 20 18
Total $ 135 $ 127
Nondiscretionary client assets under administration
Personal $ 28 $ 28
Institutional 100 92
Total $ 128 $ 120
Asset Type
Equity $ 76 $ 72
Fixed Income 32 31
Liquidity/Other 20 17
Total $ 128 $ 120
(a) As of December 31.
(b) Includes nonperforming loans of $62 million at December 31, 2014 and $70 million
at December 31, 2013.
(c) Recorded investment of purchased impaired loans related to acquisitions.
(d) Excludes brokerage account client assets.
56 The PNC Financial Services Group, Inc. – Form 10-K