PNC Bank 2014 Annual Report Download - page 98
Download and view the complete annual report
Please find page 98 of the 2014 PNC Bank annual report below. You can navigate through the pages in the report by either clicking on the pages listed below, or by using the keyword search tool below to find specific information within the annual report.-
 1
1 -
2
-
3
-
4
-
5
-
6
-
7
-
8
-
9
-
10
-
11
-
12
-
13
-
14
-
15
-
16
-
17
-
18
-
19
-
20
-
21
-
22
-
23
-
24
-
25
-
26
-
27
-
28
-
29
-
30
-
31
-
32
-
33
-
34
-
35
-
36
-
37
-
38
-
39
-
40
-
41
-
42
-
43
-
44
-
45
-
46
-
47
-
48
-
49
-
50
-
51
-
52
-
53
-
54
-
55
-
56
-
57
-
58
-
59
-
60
-
61
-
62
-
63
-
64
-
65
-
66
-
67
-
68
-
69
-
70
-
71
-
72
-
73
-
74
-
75
-
76
-
77
-
78
-
79
-
80
-
81
-
82
-
83
-
84
-
85
-
86
-
87
-
 88
88 -
 89
89 -
 90
90 -
 91
91 -
 92
92 -
 93
93 -
 94
94 -
 95
95 -
 96
96 -
 97
97 -
 98
98 -
 99
99 -
 100
100 -
 101
101 -
 102
102 -
 103
103 -
 104
104 -
 105
105 -
 106
106 -
 107
107 -
 108
108 -
109
-
110
-
111
-
112
-
113
-
114
-
115
-
116
-
117
-
118
-
119
-
120
-
121
-
122
-
123
-
124
-
125
-
126
-
127
-
128
-
129
-
130
-
131
-
132
-
133
-
134
-
135
-
136
-
137
-
138
-
139
-
140
-
141
-
142
-
143
-
144
-
145
-
146
-
147
-
148
-
149
-
150
-
151
-
152
-
153
-
154
-
155
-
156
-
157
-
158
-
159
-
160
-
161
-
162
-
163
-
164
-
165
-
166
-
167
-
168
-
169
-
170
-
171
-
172
-
173
-
174
-
175
-
176
-
177
-
178
-
179
-
180
-
181
-
182
-
183
-
184
-
185
-
186
-
187
-
188
-
189
-
190
-
191
-
192
-
193
-
194
-
195
-
196
-
197
-
198
-
199
-
200
-
201
-
202
-
203
-
204
-
205
-
206
-
207
-
208
-
209
-
210
-
211
-
212
-
213
-
214
-
215
-
216
-
217
-
218
-
219
-
220
-
221
-
222
-
223
-
224
-
225
-
226
-
227
-
228
-
229
-
230
-
231
-
232
-
233
-
234
-
235
-
236
-
237
-
238
-
239
-
240
-
241
-
242
-
243
-
244
-
245
-
246
-
247
-
248
-
249
-
250
-
251
-
252
-
253
-
254
-
255
-
256
-
257
-
258
-
259
-
260
-
261
-
262
-
263
-
264
-
265
-
266
-
267
-
268
 |
 |
Allowances For Loan And Lease Losses And Unfunded
Loan Commitments And Letters Of Credit
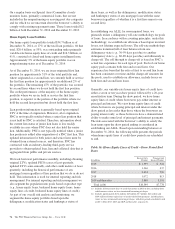
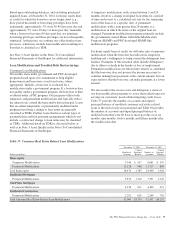
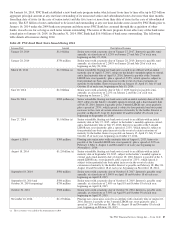
We recorded $.5 billion in net charge-offs for 2014, compared
to $1.1 billion for 2013. Commercial lending net charge-offs
decreased from $249 million in 2013 to $55 million in 2014.
Consumer lending net charge-offs decreased from $828
million in 2013, which included $134 million due to the
impact of alignment with interagency supervisory guidance, to
$476 million in 2014.
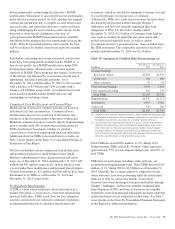
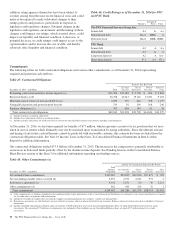
Table 40: Loan Charge-Offs And Recoveries
Year ended December 31
Dollars in millions
Gross
Charge-offs Recoveries
Net
Charge-offs /
(Recoveries)
Percent of
Average Loans
2014
Commercial $ 276 $207 $ 69 .07%
Commercial real estate 70 84 (14) (.06)
Equipment lease
financing 14 14
Home equity 275 78 197 .56
Residential real estate 40 26 14 .10
Credit card 163 21 142 3.24
Other consumer 183 60 123 .54
Total $1,021 $490 $ 531 .27
2013
Commercial $ 395 $248 $ 147 .17%
Commercial real estate 203 93 110 .57
Equipment lease
financing 8 16 (8) (.11)
Home equity 486 73 413 1.14
Residential real estate 133 4 129 .86
Credit card 178 22 156 3.75
Other consumer 185 55 130 .60
Total $1,588 $511 $1,077 .57
Total net charge-offs are lower than they would have been
otherwise due to the accounting treatment for purchased
impaired loans. This treatment also results in a lower ratio of
net charge-offs to average loans. See Note 4 Purchased Loans
in the Notes To Consolidated Financial Statements in Item 8
of this Report for additional information on net charge-offs
related to these loans.
We maintain an ALLL to absorb losses from the loan and
lease portfolio and determine this allowance based on
quarterly assessments of the estimated probable credit losses
incurred in the loan and lease portfolio. We maintain the
ALLL at a level that we believe to be appropriate to absorb
estimated probable credit losses incurred in the loan and lease
portfolio as of the balance sheet date. The reserve calculation
and determination process is dependent on the use of key
assumptions. Key reserve assumptions and estimation
processes react to and are influenced by observed changes in
loan and lease portfolio performance experience, the financial
strength of the borrower, and economic conditions. Key
reserve assumptions are periodically updated.
We establish specific allowances for loans considered
impaired using methods prescribed by GAAP. All impaired
loans are subject to individual analysis, except leases and
large groups of smaller-balance homogeneous loans which
may include, but are not limited to, credit card, residential real
estate secured and consumer installment loans. Specific
allowances for individual loans (including commercial and
consumer TDRs) are determined based on an analysis of the
present value of expected future cash flows from the loans
discounted at their effective interest rate, observable market
price or the fair value of the underlying collateral.
Reserves allocated to non-impaired commercial loan classes
are based on PD and LGD credit risk ratings.
Our commercial pool reserve methodology is sensitive to
changes in key risk parameters such as PD and LGD. The
results of these parameters are then applied to the loan balance
and unfunded loan commitments and letters of credit to
determine the amount of the respective reserves. Our PDs and
LGDs are primarily determined using internal commercial
loan loss data. This internal data is supplemented with third-
party data and management judgment, as deemed necessary.
We continue to evaluate and enhance our use of internal
commercial loss data and will periodically update our PDs and
LGDs as well as consider third-party data, regulatory guidance
and management judgment.
The majority of the commercial portfolio is secured by
collateral, including loans to asset-based lending customers,
which continues to demonstrate lower LGD compared to loans
not secured by collateral. Further, the large investment grade
or equivalent portion of the loan portfolio has performed well
and has not been subject to significant deterioration.
Additionally, guarantees on loans greater than $1 million and
owner guarantees for small business loans do not significantly
impact our ALLL.
Allocations to non-impaired consumer loan classes are
primarily based upon a roll-rate model which uses statistical
relationships, calculated from historical data that estimate the
movement of loan outstandings through the various stages of
delinquency and ultimately charge-off.
A portion of the ALLL is related to qualitative and
measurement factors. These factors may include, but are not
limited to, the following:
• Industry concentrations and conditions,
• Recent credit quality trends,
• Recent loss experience in particular portfolios,
• Recent macro-economic factors,
• Model imprecision,
• Changes in lending policies and procedures,
80 The PNC Financial Services Group, Inc. – Form 10-K