PNC Bank 2014 Annual Report Download - page 216
Download and view the complete annual report
Please find page 216 of the 2014 PNC Bank annual report below. You can navigate through the pages in the report by either clicking on the pages listed below, or by using the keyword search tool below to find specific information within the annual report.-
 1
1 -
2
-
3
-
4
-
5
-
6
-
7
-
8
-
9
-
10
-
11
-
12
-
13
-
14
-
15
-
16
-
17
-
18
-
19
-
20
-
21
-
22
-
23
-
24
-
25
-
26
-
27
-
28
-
29
-
30
-
31
-
32
-
33
-
34
-
35
-
36
-
37
-
38
-
39
-
40
-
41
-
42
-
43
-
44
-
45
-
46
-
47
-
48
-
49
-
50
-
51
-
52
-
53
-
54
-
55
-
56
-
57
-
58
-
59
-
60
-
61
-
62
-
63
-
64
-
65
-
66
-
67
-
68
-
69
-
70
-
71
-
72
-
73
-
74
-
75
-
76
-
77
-
78
-
79
-
80
-
81
-
82
-
83
-
84
-
85
-
86
-
87
-
88
-
89
-
90
-
91
-
92
-
93
-
94
-
95
-
96
-
97
-
98
-
99
-
100
-
101
-
102
-
103
-
104
-
105
-
106
-
107
-
108
-
109
-
110
-
111
-
112
-
113
-
114
-
115
-
116
-
117
-
118
-
119
-
120
-
121
-
122
-
123
-
124
-
125
-
126
-
127
-
128
-
129
-
130
-
131
-
132
-
133
-
134
-
135
-
136
-
137
-
138
-
139
-
140
-
141
-
142
-
143
-
144
-
145
-
146
-
147
-
148
-
149
-
150
-
151
-
152
-
153
-
154
-
155
-
156
-
157
-
158
-
159
-
160
-
161
-
162
-
163
-
164
-
165
-
166
-
167
-
168
-
169
-
170
-
171
-
172
-
173
-
174
-
175
-
176
-
177
-
178
-
179
-
180
-
181
-
182
-
183
-
184
-
185
-
186
-
187
-
188
-
189
-
190
-
191
-
192
-
193
-
194
-
195
-
196
-
197
-
198
-
199
-
200
-
201
-
202
-
203
-
204
-
205
-
 206
206 -
 207
207 -
 208
208 -
 209
209 -
 210
210 -
 211
211 -
 212
212 -
 213
213 -
 214
214 -
 215
215 -
 216
216 -
 217
217 -
 218
218 -
 219
219 -
 220
220 -
 221
221 -
 222
222 -
 223
223 -
 224
224 -
 225
225 -
 226
226 -
227
-
228
-
229
-
230
-
231
-
232
-
233
-
234
-
235
-
236
-
237
-
238
-
239
-
240
-
241
-
242
-
243
-
244
-
245
-
246
-
247
-
248
-
249
-
250
-
251
-
252
-
253
-
254
-
255
-
256
-
257
-
258
-
259
-
260
-
261
-
262
-
263
-
264
-
265
-
266
-
267
-
268
 |
 |

N
OTE
18 O
THER
C
OMPREHENSIVE
I
NCOME
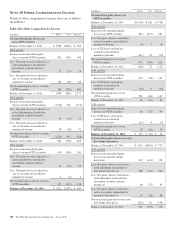
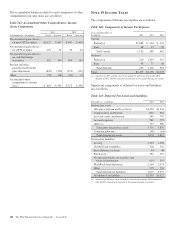
Details of other comprehensive income (loss) are as follows
(in millions):
Table 140: Other Comprehensive Income
In millions Pretax Tax After-tax
Net unrealized gains (losses) on
non-OTTI securities
Balance at December 31, 2011 $ 1,098 $(402) $ 696
2012 activity
Increase in net unrealized gains
(losses) on non-OTTI securities 931 (341) 590
Less: Net gains (losses) realized as a
yield adjustment reclassified to
investment securities interest
income 37 (13) 24
Less: Net gains (losses) realized on
sale of securities reclassified to
noninterest income 134 (49) 85
Net unrealized gains (losses) on non-
OTTI securities 760 (279) 481
Balance at December 31, 2012 1,858 (681) 1,177
2013 activity
Increase in net unrealized gains
(losses) on non-OTTI securities (1,122) 411 (711)
Less: Net gains (losses) realized as a
yield adjustment reclassified to
investment securities interest
income 39 (14) 25
Less: Net gains (losses) realized on
sale of securities reclassified to
noninterest income 50 (18) 32
Net unrealized gains (losses) on non-
OTTI securities (1,211) 443 (768)
Balance at December 31, 2013 647 (238) 409
2014 activity
Increase in net unrealized gains
(losses) on non-OTTI securities 410 (150) 260
Less: Net gains (losses) realized as a
yield adjustment reclassified to
investment securities interest
income 31 (11) 20
Less: Net gains (losses) realized on
sale of securities reclassified to
noninterest income 4 (2) 2
Net unrealized gains (losses) on non-
OTTI securities 375 (137) 238
Balance at December 31, 2014 $ 1,022 $(375) $ 647
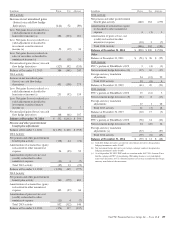
In millions Pretax Tax After-tax
Net unrealized gains (losses) on
OTTI securities
Balance at December 31, 2011 $(1,166) $ 428 $ (738)
2012 activity
Increase in net unrealized gains
(losses) on OTTI securities 854 (313) 541
Less: Net gains (losses) realized on
sales of securities reclassified to
noninterest income (6) 2 (4)
Less: OTTI losses realized on
securities reclassified to
noninterest income (111) 41 (70)
Net unrealized gains (losses) on
OTTI securities 971 (356) 615
Balance at December 31, 2012 (195) 72 (123)
2013 activity
Increase in net unrealized gains
(losses) on OTTI securities 215 (78) 137
Less: OTTI losses realized on
securities reclassified to
noninterest income (16) 6 (10)
Net unrealized gains (losses) on
OTTI securities 231 (84) 147
Balance at December 31, 2013 36 (12) 24
2014 activity
Increase in net unrealized gains
(losses) on OTTI securities 68 (25) 43
Less: OTTI losses realized on
securities reclassified to
noninterest income (11) 4 (7)
Net unrealized gains (losses) on
OTTI securities 79 (29) 50
Balance at December 31, 2014 $ 115 $ (41) $ 74
Net unrealized gains (losses) on cash
flow hedge derivatives
Balance at December 31, 2011 $ 1,131 $(414) $ 717
2012 activity
Increase in net unrealized gains
(losses) on cash flow hedge
derivatives 312 (114) 198
Less: Net gains (losses) realized as a
yield adjustment reclassified to
loan interest income (a) 388 (142) 246
Less: Net gains (losses) realized as a
yield adjustment reclassified to
investment securities interest
income (a) 68 (25) 43
Less: Net gains (losses) realized on
sales of securities reclassified to
noninterest income (a) 76 (28) 48
Net unrealized gains (losses) on cash
flow hedge derivatives (220) 81 (139)
Balance at December 31, 2012 911 (333) 578
198 The PNC Financial Services Group, Inc. – Form 10-K