PNC Bank 2014 Annual Report Download - page 202
Download and view the complete annual report
Please find page 202 of the 2014 PNC Bank annual report below. You can navigate through the pages in the report by either clicking on the pages listed below, or by using the keyword search tool below to find specific information within the annual report.-
 1
1 -
2
-
3
-
4
-
5
-
6
-
7
-
8
-
9
-
10
-
11
-
12
-
13
-
14
-
15
-
16
-
17
-
18
-
19
-
20
-
21
-
22
-
23
-
24
-
25
-
26
-
27
-
28
-
29
-
30
-
31
-
32
-
33
-
34
-
35
-
36
-
37
-
38
-
39
-
40
-
41
-
42
-
43
-
44
-
45
-
46
-
47
-
48
-
49
-
50
-
51
-
52
-
53
-
54
-
55
-
56
-
57
-
58
-
59
-
60
-
61
-
62
-
63
-
64
-
65
-
66
-
67
-
68
-
69
-
70
-
71
-
72
-
73
-
74
-
75
-
76
-
77
-
78
-
79
-
80
-
81
-
82
-
83
-
84
-
85
-
86
-
87
-
88
-
89
-
90
-
91
-
92
-
93
-
94
-
95
-
96
-
97
-
98
-
99
-
100
-
101
-
102
-
103
-
104
-
105
-
106
-
107
-
108
-
109
-
110
-
111
-
112
-
113
-
114
-
115
-
116
-
117
-
118
-
119
-
120
-
121
-
122
-
123
-
124
-
125
-
126
-
127
-
128
-
129
-
130
-
131
-
132
-
133
-
134
-
135
-
136
-
137
-
138
-
139
-
140
-
141
-
142
-
143
-
144
-
145
-
146
-
147
-
148
-
149
-
150
-
151
-
152
-
153
-
154
-
155
-
156
-
157
-
158
-
159
-
160
-
161
-
162
-
163
-
164
-
165
-
166
-
167
-
168
-
169
-
170
-
171
-
172
-
173
-
174
-
175
-
176
-
177
-
178
-
179
-
180
-
181
-
182
-
183
-
184
-
185
-
186
-
187
-
188
-
189
-
190
-
191
-
 192
192 -
 193
193 -
 194
194 -
 195
195 -
 196
196 -
 197
197 -
 198
198 -
 199
199 -
 200
200 -
 201
201 -
 202
202 -
 203
203 -
 204
204 -
 205
205 -
 206
206 -
 207
207 -
 208
208 -
 209
209 -
 210
210 -
 211
211 -
 212
212 -
213
-
214
-
215
-
216
-
217
-
218
-
219
-
220
-
221
-
222
-
223
-
224
-
225
-
226
-
227
-
228
-
229
-
230
-
231
-
232
-
233
-
234
-
235
-
236
-
237
-
238
-
239
-
240
-
241
-
242
-
243
-
244
-
245
-
246
-
247
-
248
-
249
-
250
-
251
-
252
-
253
-
254
-
255
-
256
-
257
-
258
-
259
-
260
-
261
-
262
-
263
-
264
-
265
-
266
-
267
-
268
 |
 |

N
OTE
14 S
TOCK
B
ASED
C
OMPENSATION
P
LANS
We have long-term incentive award plans (Incentive Plans) that
provide for the granting of incentive stock options, nonqualified
stock options, stock appreciation rights, incentive shares/
performance units, restricted stock, restricted share units, other
share-based awards and dollar-denominated awards to
executives and, other than incentive stock options, to non-
employee directors. Certain Incentive Plan awards may be paid
in stock, cash or a combination of stock and cash. We typically
grant a substantial portion of our stock-based compensation
awards during the first quarter of the year. As of December 31,
2014, no stock appreciation rights were outstanding.
Total compensation expense recognized related to all share-
based payment arrangements during 2014, 2013 and 2012 was
approximately $181 million, $154 million and $101 million,
respectively. The total tax benefit recognized related to
compensation expense on all share-based payment
arrangements during 2014, 2013 and 2012 was approximately
$66 million, $56 million and $37 million, respectively. At
December 31, 2014, there was $153 million of unamortized
share-based compensation expense related to nonvested equity
compensation arrangements granted under the Incentive Plans.
This unamortized cost is expected to be recognized as expense
over a period of no longer than five years.
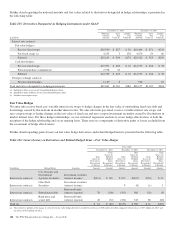
Nonqualified Stock Options
Beginning in 2014, PNC discontinued the use of stock options as
a standard element of our long-term equity incentive
compensation programs under our Incentive Plans and did not
grant any options in 2014. Prior to 2014, options were granted at
exercise prices not less than the market value of common stock on
the grant date. Generally, options become exercisable in
installments after the grant date. No option may be exercisable
after 10 years from its grant date. Payment of the option exercise
price may be in cash or by surrendering shares of common stock
at market value on the exercise date. The exercise price may also
be paid by using previously owned shares.
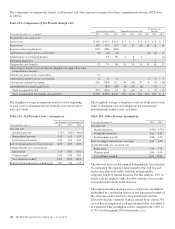
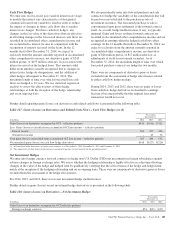
Option Pricing Assumptions
For purposes of computing stock option expense for grants
made in 2013 and 2012, we estimated the fair value of stock
options at the grant date primarily by using the Black-Scholes
option-pricing model. Option pricing models require the use
of numerous assumptions, many of which are subjective.
We used the following assumptions in the option pricing
models to determine 2013 and 2012 grant date fair value:
• The risk-free interest rate is based on the U.S.
Treasury yield curve,
• The dividend yield typically represents average
yields over the previous three-year period, however
starting with the grants made after the first quarter of
2009, we used a yield indicative of our current
dividend rate,
• Volatility is measured using the fluctuation in month-
end closing stock prices over a period which
corresponds with the average expected option life,
but in no case less than a five-year period, and
• The expected life assumption represents the period of
time that options granted are expected to be
outstanding and is based on a weighted-average of
historical option activity.
Table 119: Option Pricing Assumptions (a)
Weighted-average for the
year ended December 31 2013 2012
Risk-free interest rate .9% 1.1 %
Dividend yield 2.5 2.3
Volatility 34.0 35.1
Expected life 6.5yrs. 5.9yrs.
Grant date fair value $ 16.35 $ 16.22
(a) PNC did not grant any stock options in 2014.
There were no options granted in 2013 and 2012 where the grant date fair value exceeded the market value.
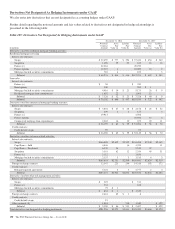
Table 120: Stock Option Rollforward
PNC
PNC Options
Converted From
National City Total
Year ended December 31, 2014
In thousands, except weighted-average data Shares
Weighted-
Average
Exercise
Price Shares
Weighted-
Average
Exercise
Price Shares
Weighted-
Average
Exercise
Price
Weighted-
Average
Remaining
Contractual
Life
Aggregate
Intrinsic
Value
Outstanding, January 1 10,354 $57.57 544 $662.28 10,898 $ 87.75
Granted (a)
Exercised (3,589) 59.80 (3,589) 59.80
Cancelled (64) 53.42 (201) 793.93 (265) 615.70
Outstanding, December 31 6,701 $56.41 343 $585.23 7,044 $ 82.17 3.9 years $233,345
Vested and expected to vest, December 31 (b) 6,699 $56.41 343 $585.23 7,042 $ 82.18 3.9 years $233,277
Exercisable, December 31 6,467 $56.21 343 $585.23 6,810 $ 82.86 3.8 years $226,506
(a) PNC did not grant any stock options in 2014.
(b) Adjusted for estimated forfeitures on unvested options.
184 The PNC Financial Services Group, Inc. – Form 10-K