PNC Bank 2014 Annual Report Download - page 183
Download and view the complete annual report
Please find page 183 of the 2014 PNC Bank annual report below. You can navigate through the pages in the report by either clicking on the pages listed below, or by using the keyword search tool below to find specific information within the annual report.-
 1
1 -
2
-
3
-
4
-
5
-
6
-
7
-
8
-
9
-
10
-
11
-
12
-
13
-
14
-
15
-
16
-
17
-
18
-
19
-
20
-
21
-
22
-
23
-
24
-
25
-
26
-
27
-
28
-
29
-
30
-
31
-
32
-
33
-
34
-
35
-
36
-
37
-
38
-
39
-
40
-
41
-
42
-
43
-
44
-
45
-
46
-
47
-
48
-
49
-
50
-
51
-
52
-
53
-
54
-
55
-
56
-
57
-
58
-
59
-
60
-
61
-
62
-
63
-
64
-
65
-
66
-
67
-
68
-
69
-
70
-
71
-
72
-
73
-
74
-
75
-
76
-
77
-
78
-
79
-
80
-
81
-
82
-
83
-
84
-
85
-
86
-
87
-
88
-
89
-
90
-
91
-
92
-
93
-
94
-
95
-
96
-
97
-
98
-
99
-
100
-
101
-
102
-
103
-
104
-
105
-
106
-
107
-
108
-
109
-
110
-
111
-
112
-
113
-
114
-
115
-
116
-
117
-
118
-
119
-
120
-
121
-
122
-
123
-
124
-
125
-
126
-
127
-
128
-
129
-
130
-
131
-
132
-
133
-
134
-
135
-
136
-
137
-
138
-
139
-
140
-
141
-
142
-
143
-
144
-
145
-
146
-
147
-
148
-
149
-
150
-
151
-
152
-
153
-
154
-
155
-
156
-
157
-
158
-
159
-
160
-
161
-
162
-
163
-
164
-
165
-
166
-
167
-
168
-
169
-
170
-
171
-
172
-
 173
173 -
 174
174 -
 175
175 -
 176
176 -
 177
177 -
 178
178 -
 179
179 -
 180
180 -
 181
181 -
 182
182 -
 183
183 -
 184
184 -
 185
185 -
 186
186 -
 187
187 -
 188
188 -
 189
189 -
 190
190 -
 191
191 -
 192
192 -
 193
193 -
194
-
195
-
196
-
197
-
198
-
199
-
200
-
201
-
202
-
203
-
204
-
205
-
206
-
207
-
208
-
209
-
210
-
211
-
212
-
213
-
214
-
215
-
216
-
217
-
218
-
219
-
220
-
221
-
222
-
223
-
224
-
225
-
226
-
227
-
228
-
229
-
230
-
231
-
232
-
233
-
234
-
235
-
236
-
237
-
238
-
239
-
240
-
241
-
242
-
243
-
244
-
245
-
246
-
247
-
248
-
249
-
250
-
251
-
252
-
253
-
254
-
255
-
256
-
257
-
258
-
259
-
260
-
261
-
262
-
263
-
264
-
265
-
266
-
267
-
268
 |
 |

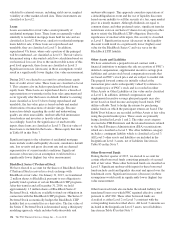
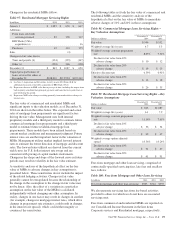
Equity Investments
Equity investments represent the carrying value of Low
Income Housing Tax Credit (LIHTC) investments held for
sale calculated using a discounted cash flow model. The
significant unobservable input is management’s estimate of
required market rate of return. The market rate of return is
based on comparison to recent LIHTC sales in the market.
Significant increases (decreases) in this input would result in a
significantly lower (higher) carrying value of the investments.
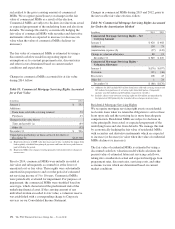
Commercial Mortgage Servicing Rights
As of January 1, 2014, PNC made an irrevocable election to
subsequently measure all classes of commercial MSRs at fair
value in order to eliminate any potential measurement
mismatch between our economic hedges and the commercial
MSRs. Refer to the Fair Value Measurement section of this
Note 7 regarding the fair value of commercial MSRs.
Prior to 2014, commercial MSRs were initially recorded at
fair value and subsequently accounted for at the lower of
amortized cost or fair value. They were periodically evaluated
for impairment and the amounts in Table 86 reflect an
impairment of three strata at December 31, 2013 and two
strata at December 31, 2012, respectively. For purposes of
impairment, the commercial MSRs were stratified based on
asset type, which characterizes the predominant risk of the
underlying financial asset. The fair value of commercial
MSRs was estimated by using a discounted cash flow model
incorporating unobservable inputs for assumptions as to
constant prepayment rates, discount rates and other factors.
Significant increases (decreases) in constant prepayment rates
and discount rates would result in significantly lower (higher)
commercial MSR value determined based on current market
conditions and expectations.
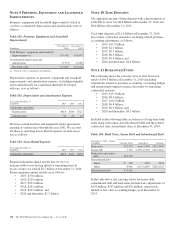
OREO and Foreclosed Assets
OREO and foreclosed assets represent the carrying value of
OREO and foreclosed assets for which valuation adjustments
were recorded subsequent to the transfer to OREO and
foreclosed assets. Valuation adjustments are based on the fair
value less cost to sell of the property. Fair value is based on
appraised value or sales price.
The appraisal process for OREO and foreclosed properties is
the same as described above for nonaccrual loans. In instances
where we have agreed to sell the property to a third party, the
fair value is based on the contractual sale price adjusted for
costs to sell. The significant unobservable inputs for OREO
and foreclosed assets are the appraised value or the sales price.
The estimated costs to sell are incremental direct costs to
transact a sale such as broker commissions, legal, closing
costs and title transfer fees. The costs must be essential to the
sale and would not have been incurred if the decision to sell
had not been made. The costs to sell are based on costs
associated with our sales of commercial and residential OREO
and foreclosed assets, which are assessed annually.
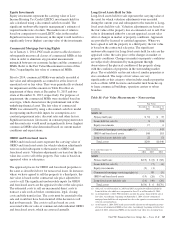
Long-Lived Assets Held for Sale
Long-lived assets held for sale represent the carrying value of
the asset for which valuation adjustments were recorded
during the current year and subsequent to the transfer to Long-
lived assets held for sale. Valuation adjustments are based on
the fair value of the property less an estimated cost to sell. Fair
value is determined either by a recent appraisal, recent sales
offer or changes in market or property conditions. Appraisals
are provided by licensed or certified appraisers. Where we
have agreed to sell the property to a third party, the fair value
is based on the contractual sale price. The significant
unobservable inputs for Long-lived assets held for sale are the
appraised value, the sales price or the changes in market or
property conditions. Changes in market or property conditions
are subjectively determined by management through
observation of the physical condition of the property along
with the condition of properties in the surrounding market
place. The availability and recent sales of similar properties is
also considered. The range of fair values can vary
significantly as this category often includes smaller properties
such as offsite ATM locations and smaller rural branches up
to large commercial buildings, operation centers or urban
branches.
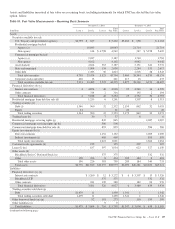
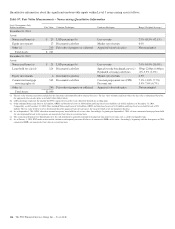
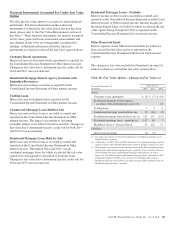
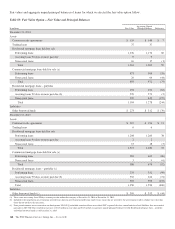
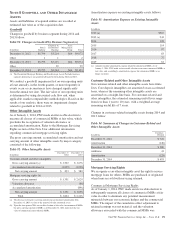
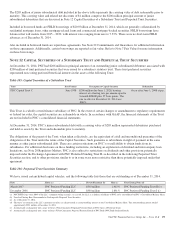
Table 86: Fair Value Measurements – Nonrecurring
Fair Value
In millions
December 31
2014
December 31
2013
Assets (a)
Nonaccrual loans $ 54 $ 35
Loans held for sale (b) 8 224
Equity investments 17 6
Commercial mortgage servicing rights (c) 543
OREO and foreclosed assets 168 181
Long-lived assets held for sale 22 51
Total assets $269 $1,040
Year ended December 31
In millions
Gains (Losses)
2014 2013 2012
Assets
Nonaccrual loans $(19) $ (8) $ (68)
Loans held for sale (b) (7) (4)
Equity investments (2) (1)
Commercial mortgage servicing rights (c) 88 (5)
OREO and foreclosed assets (19) (26) (73)
Long-lived assets held for sale (14) (40) (20)
Total assets $(54) $ 6 $(170)
(a) All Level 3 as of December 31, 2014 and 2013 except for $8 million included in
Loans held for sale which was categorized as Level 2 as of December 31, 2014.
(b) As of September 1, 2014, PNC elected to account for agency loans held for sale at
fair value. Accordingly, beginning on September 1, 2014, all new commercial
mortgage loans held for sale originated for sale to the agencies are measured at fair
value on a recurring basis.
(c) As of January 1, 2014, PNC made an irrevocable election to subsequently measure
all classes of commercial MSRs at fair value. Accordingly, beginning with the first
quarter of 2014, commercial MSRs are measured at fair value on a recurring basis.
The PNC Financial Services Group, Inc. – Form 10-K 165