PNC Bank 2014 Annual Report Download - page 177
Download and view the complete annual report
Please find page 177 of the 2014 PNC Bank annual report below. You can navigate through the pages in the report by either clicking on the pages listed below, or by using the keyword search tool below to find specific information within the annual report.-
 1
1 -
2
-
3
-
4
-
5
-
6
-
7
-
8
-
9
-
10
-
11
-
12
-
13
-
14
-
15
-
16
-
17
-
18
-
19
-
20
-
21
-
22
-
23
-
24
-
25
-
26
-
27
-
28
-
29
-
30
-
31
-
32
-
33
-
34
-
35
-
36
-
37
-
38
-
39
-
40
-
41
-
42
-
43
-
44
-
45
-
46
-
47
-
48
-
49
-
50
-
51
-
52
-
53
-
54
-
55
-
56
-
57
-
58
-
59
-
60
-
61
-
62
-
63
-
64
-
65
-
66
-
67
-
68
-
69
-
70
-
71
-
72
-
73
-
74
-
75
-
76
-
77
-
78
-
79
-
80
-
81
-
82
-
83
-
84
-
85
-
86
-
87
-
88
-
89
-
90
-
91
-
92
-
93
-
94
-
95
-
96
-
97
-
98
-
99
-
100
-
101
-
102
-
103
-
104
-
105
-
106
-
107
-
108
-
109
-
110
-
111
-
112
-
113
-
114
-
115
-
116
-
117
-
118
-
119
-
120
-
121
-
122
-
123
-
124
-
125
-
126
-
127
-
128
-
129
-
130
-
131
-
132
-
133
-
134
-
135
-
136
-
137
-
138
-
139
-
140
-
141
-
142
-
143
-
144
-
145
-
146
-
147
-
148
-
149
-
150
-
151
-
152
-
153
-
154
-
155
-
156
-
157
-
158
-
159
-
160
-
161
-
162
-
163
-
164
-
165
-
166
-
 167
167 -
 168
168 -
 169
169 -
 170
170 -
 171
171 -
 172
172 -
 173
173 -
 174
174 -
 175
175 -
 176
176 -
 177
177 -
 178
178 -
 179
179 -
 180
180 -
 181
181 -
 182
182 -
 183
183 -
 184
184 -
 185
185 -
 186
186 -
 187
187 -
188
-
189
-
190
-
191
-
192
-
193
-
194
-
195
-
196
-
197
-
198
-
199
-
200
-
201
-
202
-
203
-
204
-
205
-
206
-
207
-
208
-
209
-
210
-
211
-
212
-
213
-
214
-
215
-
216
-
217
-
218
-
219
-
220
-
221
-
222
-
223
-
224
-
225
-
226
-
227
-
228
-
229
-
230
-
231
-
232
-
233
-
234
-
235
-
236
-
237
-
238
-
239
-
240
-
241
-
242
-
243
-
244
-
245
-
246
-
247
-
248
-
249
-
250
-
251
-
252
-
253
-
254
-
255
-
256
-
257
-
258
-
259
-
260
-
261
-
262
-
263
-
264
-
265
-
266
-
267
-
268
 |
 |

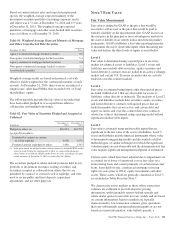
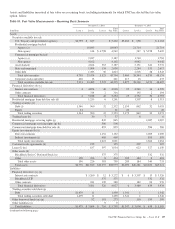
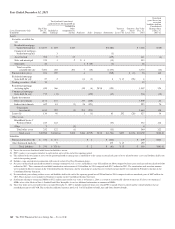
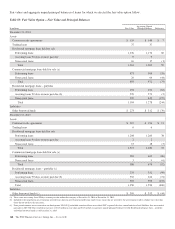
Reconciliations of assets and liabilities measured at fair value on a recurring basis using Level 3 inputs for 2014 and 2013 follow.
Table 84: Reconciliation of Level 3 Assets and Liabilities
Year Ended December 31, 2014
Total realized / unrealized
gains or losses for the period (a)
Unrealized
gains (losses)
on assets and
liabilities held on
Consolidated
Balance Sheet
at Dec. 31,
2014 (c)
Level 3 Instruments Only
In millions
Fair Value
Dec. 31,
2013
Included in
Earnings
Included
in Other
comprehensive
income Purchases Sales Issuances Settlements
Transfers
into
Level 3 (b)
Transfers
out of
Level 3 (b)
Fair Value
Dec. 31,
2014
Assets
Securities available for
sale
Residential mortgage-
backed non-agency $ 5,358 $ 120 $ 64 $ (821) $ 77 $ 4,798 $ (10)
Commercial
mortgage backed
non-agency 1 (1)
Asset-backed 641 13 23 (114) 563 (1)
State and municipal 333 (2) 15 (198) $ (14) 134
Other debt 38 1 $ 1 $ (8) (2) 30
Total securities
available for sale 6,370 133 102 1 (8) (1,136) 77 (14) 5,525 (11)
Financial derivatives 36 226 3 (223) 42 142
Residential mortgage
loans held for sale 8 1 15 (3) (1) 11 (25) 6 1
Trading securities – Debt 32 2 (31) 29 32 2
Trading loans 77
Residential mortgage
servicing rights 1,087 (238) 45 $ 85 (134) 845 (231)
Commercial mortgage
servicing rights (53) 43 53 463 (g) 506 (53)
Commercial mortgage
loans held for sale 586 38 1,790 (1,521) 893 6
Equity investments
Direct investments 1,069 184 306 (407) 1,152 134
Indirect investments 595 78 23 (223) (4) 469 74
Total equity
investments 1,664 262 329 (630) (4) 1,621 208
Loans 527 74 120 (153) (86) 20 (105) 397 46
Other assets
BlackRock Series C
Preferred Stock 332 43 375 43
Other 8 8
Total other assets 340 43 383 43
Total assets $10,650 $ 488 (e) $102 $556 $(794) $1,928 $(2,673) $144 $(144) $10,257 $ 153 (f)
Liabilities
Financial derivatives (d) $ 439 $ 222 $ 1 $ (136) $ 526 $ (51)
Other borrowed funds 199 5 $ 57 (80) 181
Other liabilities 99
Total liabilities $ 638 $ 227 (e) $ 1 $ 57 $ (207) $ 716 $ (51) (f)
(continued on following page)
The PNC Financial Services Group, Inc. – Form 10-K 159