PNC Bank 2014 Annual Report Download - page 198
Download and view the complete annual report
Please find page 198 of the 2014 PNC Bank annual report below. You can navigate through the pages in the report by either clicking on the pages listed below, or by using the keyword search tool below to find specific information within the annual report.-
 1
1 -
2
-
3
-
4
-
5
-
6
-
7
-
8
-
9
-
10
-
11
-
12
-
13
-
14
-
15
-
16
-
17
-
18
-
19
-
20
-
21
-
22
-
23
-
24
-
25
-
26
-
27
-
28
-
29
-
30
-
31
-
32
-
33
-
34
-
35
-
36
-
37
-
38
-
39
-
40
-
41
-
42
-
43
-
44
-
45
-
46
-
47
-
48
-
49
-
50
-
51
-
52
-
53
-
54
-
55
-
56
-
57
-
58
-
59
-
60
-
61
-
62
-
63
-
64
-
65
-
66
-
67
-
68
-
69
-
70
-
71
-
72
-
73
-
74
-
75
-
76
-
77
-
78
-
79
-
80
-
81
-
82
-
83
-
84
-
85
-
86
-
87
-
88
-
89
-
90
-
91
-
92
-
93
-
94
-
95
-
96
-
97
-
98
-
99
-
100
-
101
-
102
-
103
-
104
-
105
-
106
-
107
-
108
-
109
-
110
-
111
-
112
-
113
-
114
-
115
-
116
-
117
-
118
-
119
-
120
-
121
-
122
-
123
-
124
-
125
-
126
-
127
-
128
-
129
-
130
-
131
-
132
-
133
-
134
-
135
-
136
-
137
-
138
-
139
-
140
-
141
-
142
-
143
-
144
-
145
-
146
-
147
-
148
-
149
-
150
-
151
-
152
-
153
-
154
-
155
-
156
-
157
-
158
-
159
-
160
-
161
-
162
-
163
-
164
-
165
-
166
-
167
-
168
-
169
-
170
-
171
-
172
-
173
-
174
-
175
-
176
-
177
-
178
-
179
-
180
-
181
-
182
-
183
-
184
-
185
-
186
-
187
-
 188
188 -
 189
189 -
 190
190 -
 191
191 -
 192
192 -
 193
193 -
 194
194 -
 195
195 -
 196
196 -
 197
197 -
 198
198 -
 199
199 -
 200
200 -
 201
201 -
 202
202 -
 203
203 -
 204
204 -
 205
205 -
 206
206 -
 207
207 -
 208
208 -
209
-
210
-
211
-
212
-
213
-
214
-
215
-
216
-
217
-
218
-
219
-
220
-
221
-
222
-
223
-
224
-
225
-
226
-
227
-
228
-
229
-
230
-
231
-
232
-
233
-
234
-
235
-
236
-
237
-
238
-
239
-
240
-
241
-
242
-
243
-
244
-
245
-
246
-
247
-
248
-
249
-
250
-
251
-
252
-
253
-
254
-
255
-
256
-
257
-
258
-
259
-
260
-
261
-
262
-
263
-
264
-
265
-
266
-
267
-
268
 |
 |

securities, debt obligations, short-term investments,
and other marketable securities. Due to the nature of
these securities, there are no unfunded commitments
or redemption restrictions.
• Limited partnerships are valued by investment
managers based on recent financial information used
to estimate fair value. Other investments held by the
pension plan include derivative financial instruments
and real estate, which are recorded at estimated fair
value as determined by third-party appraisals and
pricing models, and group annuity contracts, which
are measured at fair value by discounting the related
cash flows based on current yields of similar
instruments with comparable durations considering
the credit-worthiness of the issuer.
These methods may result in fair value calculations that may
not be indicative of net realizable values or future fair values.
Furthermore, while the pension plan believes its valuation
methods are appropriate and consistent with other market
participants, the use of different methodologies or
assumptions to determine the fair value of certain financial
instruments could result in a different fair value measurement
at the reporting date.
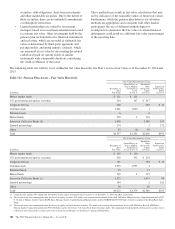
The following table sets forth by level, within the fair value hierarchy, the Plan’s assets at fair value as of December 31, 2014 and
2013.
Table 111: Pension Plan Assets – Fair Value Hierarchy
Fair Value Measurements Using:
In millions
December 31
2014
Fair Value
Quoted Prices in
Active Markets
For Identical
Assets
(Level 1)
Significant
Other
Observable
Inputs
(Level 2)
Significant
Unobservable
Inputs
(Level 3)
Money market funds $ 121 $ 121
U.S. government and agency securities 294 147 $ 147
Corporate debt (a) 648 638 $ 10
Common stock 1,041 1,040 1
Preferred stock 66
Mutual funds 220 2 218
Interest in Collective Funds (b) 1,698 1,589 109
Limited partnerships 274 2 272
Other 55 (4) 59
Total $4,357 $1,306 $2,660 $391
Fair Value Measurements Using:
In millions
December 31
2013
Fair Value
Quoted Prices in
Active Markets
For Identical
Assets (Level 1)
Significant
Other
Observable
Inputs
(Level 2)
Significant
Unobservable
Inputs
(Level 3)
Money market funds $ 130 $ 130
U.S. government and agency securities 316 192 $ 124
Corporate debt (a) 751 738 $ 13
Common stock 1,055 1,053 2
Preferred Stock 15 15
Mutual funds 199 4 195
Interest in Collective Funds (c) 1,572 1,474 98
Limited partnerships 184 2 182
Other 30 30
Total $4,252 $1,379 $2,580 $293
(a) Corporate debt includes $63 million and $84 million of non-agency mortgage-backed securities as of December 31, 2014 and 2013, respectively.
(b) The benefit plans own commingled funds that invest in equity securities. The funds seek to mirror the benchmark of the S&P 500 Index, Morgan Stanley Capital International ACWI
X US Index, Morgan Stanley Capital EAFE Index, Morgan Stanley Capital Emerging Markets Index and the NCREIF ODCE NOF Index with the exception of the BlackRock Index
Fund.
(c) The benefit plans own commingled funds that invest in equity and fixed income securities. The funds seek to mirror the performance of the S&P 500 Index, Russell 3000 Index,
Morgan Stanley Capital International ACWI X US Index and the Dow Jones U.S. Select Real Estate Securities Index. The commingled fund that holds fixed income securities invests
in domestic investment grade securities and seeks to mimic the performance of the Barclays Aggregate Bond Index.
180 The PNC Financial Services Group, Inc. – Form 10-K