PNC Bank 2014 Annual Report Download - page 166
Download and view the complete annual report
Please find page 166 of the 2014 PNC Bank annual report below. You can navigate through the pages in the report by either clicking on the pages listed below, or by using the keyword search tool below to find specific information within the annual report.-
 1
1 -
2
-
3
-
4
-
5
-
6
-
7
-
8
-
9
-
10
-
11
-
12
-
13
-
14
-
15
-
16
-
17
-
18
-
19
-
20
-
21
-
22
-
23
-
24
-
25
-
26
-
27
-
28
-
29
-
30
-
31
-
32
-
33
-
34
-
35
-
36
-
37
-
38
-
39
-
40
-
41
-
42
-
43
-
44
-
45
-
46
-
47
-
48
-
49
-
50
-
51
-
52
-
53
-
54
-
55
-
56
-
57
-
58
-
59
-
60
-
61
-
62
-
63
-
64
-
65
-
66
-
67
-
68
-
69
-
70
-
71
-
72
-
73
-
74
-
75
-
76
-
77
-
78
-
79
-
80
-
81
-
82
-
83
-
84
-
85
-
86
-
87
-
88
-
89
-
90
-
91
-
92
-
93
-
94
-
95
-
96
-
97
-
98
-
99
-
100
-
101
-
102
-
103
-
104
-
105
-
106
-
107
-
108
-
109
-
110
-
111
-
112
-
113
-
114
-
115
-
116
-
117
-
118
-
119
-
120
-
121
-
122
-
123
-
124
-
125
-
126
-
127
-
128
-
129
-
130
-
131
-
132
-
133
-
134
-
135
-
136
-
137
-
138
-
139
-
140
-
141
-
142
-
143
-
144
-
145
-
146
-
147
-
148
-
149
-
150
-
151
-
152
-
153
-
154
-
155
-
 156
156 -
 157
157 -
 158
158 -
 159
159 -
 160
160 -
 161
161 -
 162
162 -
 163
163 -
 164
164 -
 165
165 -
 166
166 -
 167
167 -
 168
168 -
 169
169 -
 170
170 -
 171
171 -
 172
172 -
 173
173 -
 174
174 -
 175
175 -
 176
176 -
177
-
178
-
179
-
180
-
181
-
182
-
183
-
184
-
185
-
186
-
187
-
188
-
189
-
190
-
191
-
192
-
193
-
194
-
195
-
196
-
197
-
198
-
199
-
200
-
201
-
202
-
203
-
204
-
205
-
206
-
207
-
208
-
209
-
210
-
211
-
212
-
213
-
214
-
215
-
216
-
217
-
218
-
219
-
220
-
221
-
222
-
223
-
224
-
225
-
226
-
227
-
228
-
229
-
230
-
231
-
232
-
233
-
234
-
235
-
236
-
237
-
238
-
239
-
240
-
241
-
242
-
243
-
244
-
245
-
246
-
247
-
248
-
249
-
250
-
251
-
252
-
253
-
254
-
255
-
256
-
257
-
258
-
259
-
260
-
261
-
262
-
263
-
264
-
265
-
266
-
267
-
268
 |
 |

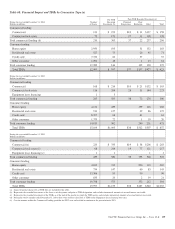
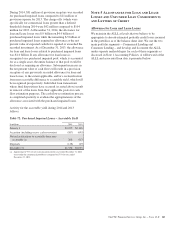
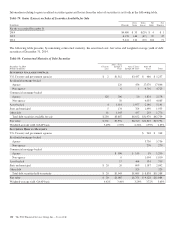
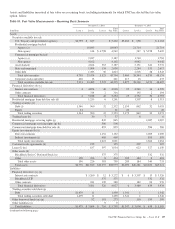
Table 76: Gross Unrealized Loss and Fair Value of Securities Available for Sale
In millions
Unrealized loss position
less than 12 months
Unrealized loss position
12 months or more Total
Unrealized
Loss
Fair
Value
Unrealized
Loss
Fair
Value
Unrealized
Loss
Fair
Value
December 31, 2014
Debt securities
U.S. Treasury and government agencies $ (1) $ 1,426 $ (1) $ 1,426
Residential mortgage-backed
Agency (4) 644 $ (37) $1,963 (41) 2,607
Non-agency (5) 276 (94) 1,487 (99) 1,763
Commercial mortgage-backed
Agency (2) 681 (12) 322 (14) 1,003
Non-agency (4) 928 (7) 335 (11) 1,263
Asset-backed (4) 913 (28) 1,133 (32) 2,046
State and municipal (a) 41 (3) 77 (3) 118
Other debt (2) 314 (4) 186 (6) 500
Total debt securities (22) 5,223 (185) 5,503 (207) 10,726
Corporate stocks and other (1) 15 (1) 15
Total $ (22) $ 5,223 $(186) $5,518 $(208) $10,741
December 31, 2013
Debt securities
U.S. Treasury and government agencies $ (7) $ 1,066 $ (7) $ 1,066
Residential mortgage-backed
Agency (b) (198) 7,519 $ (11) $ 287 (209) 7,806
Non-agency (18) 855 (142) 1,719 (160) 2,574
Commercial mortgage-backed
Agency (b) (13) 454 (1) 6 (14) 460
Non-agency (18) 1,315 (a) 14 (18) 1,329
Asset-backed (11) 1,752 (37) 202 (48) 1,954
State and municipal (23) 897 (21) 286 (44) 1,183
Other debt (17) 844 (1) 12 (18) 856
Total debt securities (305) 14,702 (213) 2,526 (518) 17,228
Corporate stocks and other (1) 15 (1) 15
Total $(306) $14,717 $(213) $2,526 $(519) $17,243
(a) The unrealized loss on these securities was less than $.5 million.
(b) These line items were corrected for the prior period due to a misclassification of Government National Mortgage Association (GNMA) securities collateralized by project loans. $1.1
billion was previously reported as residential mortgage-backed agency securities and was reclassified to commercial mortgage-backed agency securities.
The gross unrealized loss on debt securities held to maturity
was $22 million at December 31, 2014 and $98 million at
December 31, 2013. The majority of the gross unrealized loss
at December 31, 2014 related to agency residential mortgage-
backed securities. The fair value of debt securities held to
maturity that were in a continuous loss position for less than
12 months was $134 million and $3.6 billion at December 31,
2014 and December 31, 2013, respectively, and for positions
that were in a continuous loss position for 12 months or more
was $1.6 billion and $48 million at December 31, 2014 and
December 31, 2013, respectively. For securities transferred to
held to maturity from available for sale, the unrealized loss for
purposes of this analysis is determined by comparing the
security’s original amortized cost to its current estimated fair
value.
Evaluating Investment Securities for Other-than-
Temporary Impairments
For the securities in the preceding Table 76, as of
December 31, 2014 we do not intend to sell and believe we
will not be required to sell the securities prior to recovery of
the amortized cost basis.
At least quarterly, we conduct a comprehensive security-level
assessment on all securities. For those securities in an
unrealized loss position we determine if OTTI exists. An
unrealized loss exists when the current fair value of an
individual security is less than its amortized cost basis. An
OTTI loss must be recognized for a debt security in an
unrealized loss position if we intend to sell the security or it is
more likely than not we will be required to sell the security
148 The PNC Financial Services Group, Inc. – Form 10-K