PNC Bank 2014 Annual Report Download - page 172
Download and view the complete annual report
Please find page 172 of the 2014 PNC Bank annual report below. You can navigate through the pages in the report by either clicking on the pages listed below, or by using the keyword search tool below to find specific information within the annual report.-
 1
1 -
2
-
3
-
4
-
5
-
6
-
7
-
8
-
9
-
10
-
11
-
12
-
13
-
14
-
15
-
16
-
17
-
18
-
19
-
20
-
21
-
22
-
23
-
24
-
25
-
26
-
27
-
28
-
29
-
30
-
31
-
32
-
33
-
34
-
35
-
36
-
37
-
38
-
39
-
40
-
41
-
42
-
43
-
44
-
45
-
46
-
47
-
48
-
49
-
50
-
51
-
52
-
53
-
54
-
55
-
56
-
57
-
58
-
59
-
60
-
61
-
62
-
63
-
64
-
65
-
66
-
67
-
68
-
69
-
70
-
71
-
72
-
73
-
74
-
75
-
76
-
77
-
78
-
79
-
80
-
81
-
82
-
83
-
84
-
85
-
86
-
87
-
88
-
89
-
90
-
91
-
92
-
93
-
94
-
95
-
96
-
97
-
98
-
99
-
100
-
101
-
102
-
103
-
104
-
105
-
106
-
107
-
108
-
109
-
110
-
111
-
112
-
113
-
114
-
115
-
116
-
117
-
118
-
119
-
120
-
121
-
122
-
123
-
124
-
125
-
126
-
127
-
128
-
129
-
130
-
131
-
132
-
133
-
134
-
135
-
136
-
137
-
138
-
139
-
140
-
141
-
142
-
143
-
144
-
145
-
146
-
147
-
148
-
149
-
150
-
151
-
152
-
153
-
154
-
155
-
156
-
157
-
158
-
159
-
160
-
161
-
 162
162 -
 163
163 -
 164
164 -
 165
165 -
 166
166 -
 167
167 -
 168
168 -
 169
169 -
 170
170 -
 171
171 -
 172
172 -
 173
173 -
 174
174 -
 175
175 -
 176
176 -
 177
177 -
 178
178 -
 179
179 -
 180
180 -
 181
181 -
 182
182 -
183
-
184
-
185
-
186
-
187
-
188
-
189
-
190
-
191
-
192
-
193
-
194
-
195
-
196
-
197
-
198
-
199
-
200
-
201
-
202
-
203
-
204
-
205
-
206
-
207
-
208
-
209
-
210
-
211
-
212
-
213
-
214
-
215
-
216
-
217
-
218
-
219
-
220
-
221
-
222
-
223
-
224
-
225
-
226
-
227
-
228
-
229
-
230
-
231
-
232
-
233
-
234
-
235
-
236
-
237
-
238
-
239
-
240
-
241
-
242
-
243
-
244
-
245
-
246
-
247
-
248
-
249
-
250
-
251
-
252
-
253
-
254
-
255
-
256
-
257
-
258
-
259
-
260
-
261
-
262
-
263
-
264
-
265
-
266
-
267
-
268
 |
 |
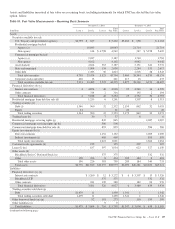
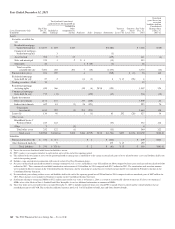
The fair values of risk participation agreement assets and
liabilities as of December 31, 2014 and 2013 are included in
the Insignificant Level 3 assets, net of liabilities line item in
Table 85 in this Note 7. The significant unobservable inputs
used in the fair value measurement of risk participation
agreements are probability of default and loss severity.
Significant increases (decreases) in probability of default and
loss severity would result in a significantly higher (lower) fair
value measurement.
In connection with the sales of portions of our Visa Class B
common shares, we entered into swap agreements with the
purchaser of the shares to account for any future risk of
converting Class B common shares to Class A common shares
and to account for the corresponding change in value to the
Class B shares. These adjustments result from resolution of
the specified litigation or the changes in the amount in the
litigation escrow account funded by Visa as well as from
changes in the estimated litigation resolution date (see Note 21
Legal Proceedings and Note 22 Commitments and Guarantees
for additional information). These swaps also require
payments calculated by reference to the market price of the
Class A common shares and a fixed rate of interest. The swaps
are classified as Level 3 instruments and the fair values of the
liability positions totaled $135 million at December 31, 2014
and $90 million at December 31, 2013, respectively. The fair
values of the swap agreements are determined using a
discounted cash flow methodology. The significant
unobservable inputs to the valuations are estimated changes in
the conversion rate of the Class B common shares into
Class A common shares and the estimated growth rate of the
Class A share price. A decrease in the conversion rate will
have a negative impact on the fair value of the swaps and vice
versa. Independent of changes in the conversion rate, an
increase in the estimated growth rate of the Class A share
price will have a negative impact on the fair value of the
swaps and vice versa, through its impact on periodic payments
due to the counterparty until the maturity dates of the swaps.
The fair values of our derivatives include a credit valuation
adjustment (CVA) to reflect our own and our counterparties’
nonperformance risk. Our CVA is computed using new loan
pricing and considers externally available bond spreads, in
conjunction with internal historical recovery observations.
Residential Mortgage Loans Held for Sale
We account for certain residential mortgage loans originated
for sale at fair value on a recurring basis. The election of the
fair value option aligns the accounting for the residential
mortgages with the related hedges. Additionally, we have
elected to account for loans repurchased due to breaches of
representations and warranties at fair value.
Residential mortgage loans are valued based on quoted market
prices, where available, prices for other traded mortgage loans
with similar characteristics, and purchase commitments and
bid information received from market participants. The prices
are adjusted as necessary to include the embedded servicing
value in the loans and to take into consideration the specific
characteristics of certain loans that are priced based on the
pricing of similar loans. These adjustments represent
unobservable inputs to the valuation but are not considered
significant given the relative insensitivity of the value to
changes in these inputs to the fair value of the loans.
Accordingly, the majority of residential mortgage loans held
for sale are classified as Level 2. This category also includes
repurchased and temporarily unsalable residential mortgage
loans. These loans are repurchased due to a breach of
representations and warranties in the loan sales agreement and
typically occur after the loan is in default. The temporarily
unsalable loans have an origination defect that makes them
currently unable to be sold into the performing loan sales
market. Because transaction details regarding sales of this type
of loan are often unavailable, unobservable bid information
from brokers and investors is heavily relied upon.
Accordingly, based on the significance of unobservable
inputs, these loans are classified as Level 3.
Trading Loans
We have elected to account for certain trading loans at fair
value. The fair value for trading loans is based on pricing from
average bid broker quotes received from a loan pricing
service, sale commitments, or a model based on indications
received in marketing the credit or on the loan’s
characteristics in comparison to market data on similar loans.
These instruments are primarily classified as Level 2.
Commercial Mortgage Servicing Rights
As of January 1, 2014, PNC made an irrevocable election to
subsequently measure all classes of commercial mortgage
servicing rights (MSRs) at fair value in order to eliminate any
potential measurement mismatch between our economic
hedges and the commercial MSRs. We recognize recurring
gains/(losses) on changes in the fair value of commercial
MSRs as a result of the election. Assumptions incorporated
into the commercial valuation model reflect management’s
best estimate of factors that a market participant would use in
valuing the commercial MSRs. Although sales of commercial
MSRs do occur, commercial MSRs do not trade in an active,
open market with readily observable prices so the precise
terms and conditions of sales are not available. Due to the
nature of the valuation inputs and the limited availability of
market pricing, commercial MSRs are classified as Level 3.
The fair value of commercial MSRs is estimated by using a
discounted cash flow model incorporating unobservable inputs
for assumptions such as constant prepayment rates, discount
rates and other factors. Significant increases/(decreases) in
constant prepayment rates and discount rates would result in
significantly lower/(higher) commercial MSR value
determined based on current market conditions and
expectations.
154 The PNC Financial Services Group, Inc. – Form 10-K