PNC Bank 2014 Annual Report Download - page 243
Download and view the complete annual report
Please find page 243 of the 2014 PNC Bank annual report below. You can navigate through the pages in the report by either clicking on the pages listed below, or by using the keyword search tool below to find specific information within the annual report.-
 1
1 -
2
-
3
-
4
-
5
-
6
-
7
-
8
-
9
-
10
-
11
-
12
-
13
-
14
-
15
-
16
-
17
-
18
-
19
-
20
-
21
-
22
-
23
-
24
-
25
-
26
-
27
-
28
-
29
-
30
-
31
-
32
-
33
-
34
-
35
-
36
-
37
-
38
-
39
-
40
-
41
-
42
-
43
-
44
-
45
-
46
-
47
-
48
-
49
-
50
-
51
-
52
-
53
-
54
-
55
-
56
-
57
-
58
-
59
-
60
-
61
-
62
-
63
-
64
-
65
-
66
-
67
-
68
-
69
-
70
-
71
-
72
-
73
-
74
-
75
-
76
-
77
-
78
-
79
-
80
-
81
-
82
-
83
-
84
-
85
-
86
-
87
-
88
-
89
-
90
-
91
-
92
-
93
-
94
-
95
-
96
-
97
-
98
-
99
-
100
-
101
-
102
-
103
-
104
-
105
-
106
-
107
-
108
-
109
-
110
-
111
-
112
-
113
-
114
-
115
-
116
-
117
-
118
-
119
-
120
-
121
-
122
-
123
-
124
-
125
-
126
-
127
-
128
-
129
-
130
-
131
-
132
-
133
-
134
-
135
-
136
-
137
-
138
-
139
-
140
-
141
-
142
-
143
-
144
-
145
-
146
-
147
-
148
-
149
-
150
-
151
-
152
-
153
-
154
-
155
-
156
-
157
-
158
-
159
-
160
-
161
-
162
-
163
-
164
-
165
-
166
-
167
-
168
-
169
-
170
-
171
-
172
-
173
-
174
-
175
-
176
-
177
-
178
-
179
-
180
-
181
-
182
-
183
-
184
-
185
-
186
-
187
-
188
-
189
-
190
-
191
-
192
-
193
-
194
-
195
-
196
-
197
-
198
-
199
-
200
-
201
-
202
-
203
-
204
-
205
-
206
-
207
-
208
-
209
-
210
-
211
-
212
-
213
-
214
-
215
-
216
-
217
-
218
-
219
-
220
-
221
-
222
-
223
-
224
-
225
-
226
-
227
-
228
-
229
-
230
-
231
-
232
-
 233
233 -
 234
234 -
 235
235 -
 236
236 -
 237
237 -
 238
238 -
 239
239 -
 240
240 -
 241
241 -
 242
242 -
 243
243 -
 244
244 -
 245
245 -
 246
246 -
 247
247 -
 248
248 -
 249
249 -
 250
250 -
 251
251 -
 252
252 -
 253
253 -
254
-
255
-
256
-
257
-
258
-
259
-
260
-
261
-
262
-
263
-
264
-
265
-
266
-
267
-
268
 |
 |

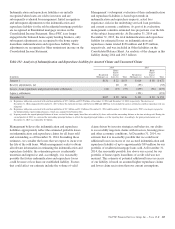
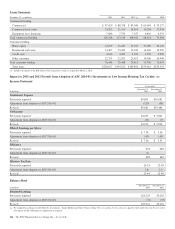
Analysis Of Year-To-Year Changes In Net Interest Income (a) (b)
2014/2013 2013/2012
Increase/(Decrease) in Income/
Expense Due to Changes in:
Increase/(Decrease) in Income/
Expense Due to Changes in:
Taxable-equivalent basis – in millions Volume Rate Total Volume Rate Total
Interest-Earning Assets
Investment securities
Securities available for sale
Residential mortgage-backed
Agency $ (99) $ 40 $ (59) $ (62) $ (101) $(163)
Non-agency (37) (36) (73) (37) 4 (33)
Commercial mortgage-backed 10 (40) (30) (24) (24)
Asset-backed (10) 5 (5) 12 (8) 4
U.S. Treasury and government agencies 32 (12) 20 (8) (10) (18)
State and municipal (5) 4 (1) 15 (9) 6
Other debt (16) 4 (12) (10) (8) (18)
Total securities available for sale (86) (74) (160) (87) (159) (246)
Securities held to maturity
Residential mortgage-backed 53 1 54 (2) (1) (3)
Commercial mortgage-backed (38) (14) (52) (38) (6) (44)
Asset-backed (1) (1) (2) 2 (3) (1)
State and municipal 54 (1) 53 3 11 14
Other (1) (1) 1 1
Total securities held to maturity 56 (4) 52 (29) (4) (33)
Total investment securities (49) (59) (108) (115) (164) (279)
Loans
Commercial 228 (442) (214) 394 (598) (204)
Commercial real estate 140 (158) (18) 72 (140) (68)
Equipment lease financing 9 (23) (14) 28 (43) (15)
Consumer 18 (153) (135) 108 (165) (57)
Residential real estate (26) (26) (52) (23) (36) (59)
Total loans 399 (832) (433) 601 (1,004) (403)
Interest-earning deposits with banks 36 1 37 7 1 8
Loans held for sale (38) (20) (58) (4) (7) (11)
Federal funds sold and resale agreements 3 (6) (3) (7) (7) (14)
Other 22 (12) 10 3 (1) (4)
Total interest-earning assets $829 $(1,384) $(555) $ 518 $(1,221) $(703)
Interest-Bearing Liabilities
Interest-bearing deposits
Money market $ 7 $ 5 $ 12 $ 10 $ (20) $ (10)
Demand 134 4 4
Savings 134 1 1
Retail certificates of deposit (20) (15) (35) (35) 5 (30)
Time deposits in foreign offices and other time 1 (5) (4) (4) (3) (7)
Total interest-bearing deposits 18 (37) (19) 16 (58) (42)
Borrowed funds
Federal funds purchased and repurchase agreements (3) (3) (1) (3) (4)
Federal Home Loan Bank borrowings 31 (3) 28 (7) (20) (27)
Bank notes and senior debt 44 (33) 11 21 (66) (45)
Subordinated debt 31 (17) 14 15 (130) (115)
Commercial paper (6) 4 (2) (4) (3) (7)
Other 20 (3) 17 2 4 6
Total borrowed funds 107 (42) 65 (30) (162) (192)
Total interest-bearing liabilities 66 (20) 46 25 (259) (234)
Change in net interest income $767 $(1,368) $(601) $ 461 $ (930) $(469)
(a) Changes attributable to rate/volume are prorated into rate and volume components.
(b) Interest income includes the effects of taxable-equivalent adjustments using a statutory federal income tax rate of 35% to increase tax-exempt interest income to a taxable-equivalent
basis. The taxable-equivalent adjustments to interest income for the years ended December 31, 2014, 2013 and 2012 were $189 million, $168 million and $144 million, respectively.
The PNC Financial Services Group, Inc. – Form 10-K 225