PNC Bank 2014 Annual Report Download - page 161
Download and view the complete annual report
Please find page 161 of the 2014 PNC Bank annual report below. You can navigate through the pages in the report by either clicking on the pages listed below, or by using the keyword search tool below to find specific information within the annual report.-
 1
1 -
2
-
3
-
4
-
5
-
6
-
7
-
8
-
9
-
10
-
11
-
12
-
13
-
14
-
15
-
16
-
17
-
18
-
19
-
20
-
21
-
22
-
23
-
24
-
25
-
26
-
27
-
28
-
29
-
30
-
31
-
32
-
33
-
34
-
35
-
36
-
37
-
38
-
39
-
40
-
41
-
42
-
43
-
44
-
45
-
46
-
47
-
48
-
49
-
50
-
51
-
52
-
53
-
54
-
55
-
56
-
57
-
58
-
59
-
60
-
61
-
62
-
63
-
64
-
65
-
66
-
67
-
68
-
69
-
70
-
71
-
72
-
73
-
74
-
75
-
76
-
77
-
78
-
79
-
80
-
81
-
82
-
83
-
84
-
85
-
86
-
87
-
88
-
89
-
90
-
91
-
92
-
93
-
94
-
95
-
96
-
97
-
98
-
99
-
100
-
101
-
102
-
103
-
104
-
105
-
106
-
107
-
108
-
109
-
110
-
111
-
112
-
113
-
114
-
115
-
116
-
117
-
118
-
119
-
120
-
121
-
122
-
123
-
124
-
125
-
126
-
127
-
128
-
129
-
130
-
131
-
132
-
133
-
134
-
135
-
136
-
137
-
138
-
139
-
140
-
141
-
142
-
143
-
144
-
145
-
146
-
147
-
148
-
149
-
150
-
 151
151 -
 152
152 -
 153
153 -
 154
154 -
 155
155 -
 156
156 -
 157
157 -
 158
158 -
 159
159 -
 160
160 -
 161
161 -
 162
162 -
 163
163 -
 164
164 -
 165
165 -
 166
166 -
 167
167 -
 168
168 -
 169
169 -
 170
170 -
 171
171 -
172
-
173
-
174
-
175
-
176
-
177
-
178
-
179
-
180
-
181
-
182
-
183
-
184
-
185
-
186
-
187
-
188
-
189
-
190
-
191
-
192
-
193
-
194
-
195
-
196
-
197
-
198
-
199
-
200
-
201
-
202
-
203
-
204
-
205
-
206
-
207
-
208
-
209
-
210
-
211
-
212
-
213
-
214
-
215
-
216
-
217
-
218
-
219
-
220
-
221
-
222
-
223
-
224
-
225
-
226
-
227
-
228
-
229
-
230
-
231
-
232
-
233
-
234
-
235
-
236
-
237
-
238
-
239
-
240
-
241
-
242
-
243
-
244
-
245
-
246
-
247
-
248
-
249
-
250
-
251
-
252
-
253
-
254
-
255
-
256
-
257
-
258
-
259
-
260
-
261
-
262
-
263
-
264
-
265
-
266
-
267
-
268
 |
 |

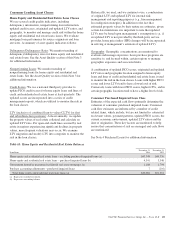
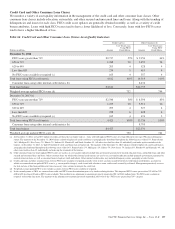
During 2014, $91 million of provision recapture was recorded
for purchased impaired loans compared to $11 million of
provision expense for 2013. The charge-offs (which were
specifically for commercial loans greater than a defined
threshold) during 2014 were $42 million compared to $104
million for 2013. At December 31, 2014, the allowance for
loan and lease losses was $.9 billion on $4.4 billion of
purchased impaired loans while the remaining $.5 billion of
purchased impaired loans required no allowance as the net
present value of expected cash flows equaled or exceeded the
recorded investment. As of December 31, 2013, the allowance
for loan and lease losses related to purchased impaired loans
was $1.0 billion. If any allowance for loan losses is
recognized on a purchased impaired pool, which is accounted
for as a single asset, the entire balance of that pool would be
disclosed as requiring an allowance. Subsequent increases in
the net present value of cash flows will result in a provision
recapture of any previously recorded allowance for loan and
lease losses, to the extent applicable, and/or a reclassification
from non-accretable difference to accretable yield, which will
be recognized prospectively. Individual loan transactions
where final dispositions have occurred (as noted above) result
in removal of the loans from their applicable pools for cash
flow estimation purposes. The cash flow re-estimation process
is completed quarterly to evaluate the appropriateness of the
allowance associated with the purchased impaired loans.
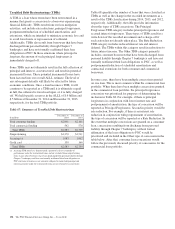
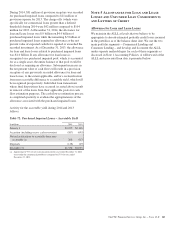
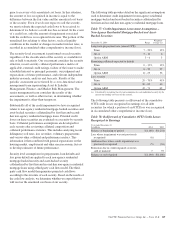
Activity for the accretable yield during 2014 and 2013
follows:
Table 72: Purchased Impaired Loans – Accretable Yield
In millions 2014 2013
January 1 $2,055 $2,166
Accretion (including excess cash recoveries) (587) (695)
Net reclassifications to accretable from non-
accretable (a) 208 613
Disposals (118) (29)
December 31 $1,558 $2,055
(a) Approximately 93% of net reclassifications for the year ended December 31, 2014
were within the commercial portfolio as compared to 37% for year ended
December 31, 2013.
N
OTE
5A
LLOWANCES FOR
L
OAN AND
L
EASE
L
OSSES AND
U
NFUNDED
L
OAN
C
OMMITMENTS
AND
L
ETTERS OF
C
REDIT
Allowance for Loan and Lease Losses
We maintain the ALLL at levels that we believe to be
appropriate to absorb estimated probable credit losses incurred
in the portfolios as of the balance sheet date. We use the two
main portfolio segments – Commercial Lending and
Consumer Lending – and develop and document the ALLL
under separate methodologies for each of these segments as
discussed in Note 1 Accounting Policies. A rollforward of the
ALLL and associated loan data is presented below.
The PNC Financial Services Group, Inc. – Form 10-K 143