PNC Bank 2014 Annual Report Download - page 60
Download and view the complete annual report
Please find page 60 of the 2014 PNC Bank annual report below. You can navigate through the pages in the report by either clicking on the pages listed below, or by using the keyword search tool below to find specific information within the annual report.-
 1
1 -
2
-
3
-
4
-
5
-
6
-
7
-
8
-
9
-
10
-
11
-
12
-
13
-
14
-
15
-
16
-
17
-
18
-
19
-
20
-
21
-
22
-
23
-
24
-
25
-
26
-
27
-
28
-
29
-
30
-
31
-
32
-
33
-
34
-
35
-
36
-
37
-
38
-
39
-
40
-
41
-
42
-
43
-
44
-
45
-
46
-
47
-
48
-
49
-
 50
50 -
 51
51 -
 52
52 -
 53
53 -
 54
54 -
 55
55 -
 56
56 -
 57
57 -
 58
58 -
 59
59 -
 60
60 -
 61
61 -
 62
62 -
 63
63 -
 64
64 -
 65
65 -
 66
66 -
 67
67 -
 68
68 -
 69
69 -
 70
70 -
71
-
72
-
73
-
74
-
75
-
76
-
77
-
78
-
79
-
80
-
81
-
82
-
83
-
84
-
85
-
86
-
87
-
88
-
89
-
90
-
91
-
92
-
93
-
94
-
95
-
96
-
97
-
98
-
99
-
100
-
101
-
102
-
103
-
104
-
105
-
106
-
107
-
108
-
109
-
110
-
111
-
112
-
113
-
114
-
115
-
116
-
117
-
118
-
119
-
120
-
121
-
122
-
123
-
124
-
125
-
126
-
127
-
128
-
129
-
130
-
131
-
132
-
133
-
134
-
135
-
136
-
137
-
138
-
139
-
140
-
141
-
142
-
143
-
144
-
145
-
146
-
147
-
148
-
149
-
150
-
151
-
152
-
153
-
154
-
155
-
156
-
157
-
158
-
159
-
160
-
161
-
162
-
163
-
164
-
165
-
166
-
167
-
168
-
169
-
170
-
171
-
172
-
173
-
174
-
175
-
176
-
177
-
178
-
179
-
180
-
181
-
182
-
183
-
184
-
185
-
186
-
187
-
188
-
189
-
190
-
191
-
192
-
193
-
194
-
195
-
196
-
197
-
198
-
199
-
200
-
201
-
202
-
203
-
204
-
205
-
206
-
207
-
208
-
209
-
210
-
211
-
212
-
213
-
214
-
215
-
216
-
217
-
218
-
219
-
220
-
221
-
222
-
223
-
224
-
225
-
226
-
227
-
228
-
229
-
230
-
231
-
232
-
233
-
234
-
235
-
236
-
237
-
238
-
239
-
240
-
241
-
242
-
243
-
244
-
245
-
246
-
247
-
248
-
249
-
250
-
251
-
252
-
253
-
254
-
255
-
256
-
257
-
258
-
259
-
260
-
261
-
262
-
263
-
264
-
265
-
266
-
267
-
268
 |
 |

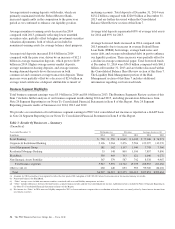
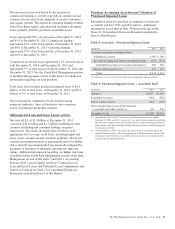
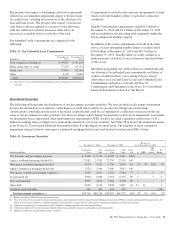
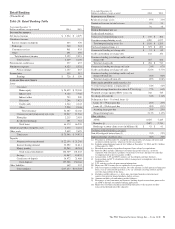
Information related to the valuation of purchased impaired loans at December 31, 2014 and December 31, 2013 follows.
Table 10: Valuation of Purchased Impaired Loans
December 31, 2014 December 31, 2013
Dollars in millions Balance Net Investment Balance Net Investment
Commercial and commercial real estate loans:
Outstanding balance (a) $ 466 $ 937
Recorded investment $ 310 $ 673
Allowance for loan losses (79) (133)
Net investment/Carrying value $ 231 50% $ 540 58%
Consumer and residential mortgage loans:
Outstanding balance (a) $ 4,541 $ 5,548
Recorded investment $ 4,548 $ 5,433
Allowance for loan losses (793) (871)
Net investment/Carrying value $ 3,755 83% $ 4,562 82%
Total purchased impaired loans:
Outstanding balance (a) $ 5,007 $ 6,485
Recorded investment $ 4,858 $ 6,106
Allowance for loan losses (872) (1,004)
Net investment/Carrying value $ 3,986 80% $ 5,102 79%
(a) Outstanding balance represents the balance on the loan servicing system for active loans. It is possible for the outstanding balance to be lower than the recorded investment for certain
loans due to the use of pool accounting. See Note 4 Purchased Loans for more information on purchased impaired loans.
At December 31, 2014, our largest individual purchased
impaired loan had a recorded investment of $9 million. We
currently expect to collect total cash flows of $5.6 billion on
purchased impaired loans, representing the $4.0 billion net
investment at December 31, 2014 and the accretable net
interest of $1.6 billion shown in Table 9.
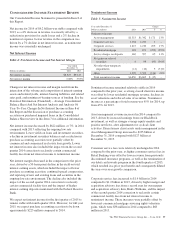
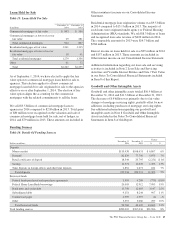
Weighted Average Life of the Purchased Impaired
Portfolios
The table below provides the weighted average life (WAL) for
each of the purchased impaired portfolios as of December 31,
2014.
Table 11: Weighted Average Life of the Purchased Impaired
Portfolios
As of December 31, 2014
Dollars in millions Recorded Investment WAL (a)
Commercial $ 74 1.8 years
Commercial real estate 236 1.3 years
Consumer (b) 1,989 3.9 years
Residential real estate 2,559 4.8 years
Total $4,858 4.1 years
(a) Weighted average life represents the average number of years for which each dollar
of unpaid principal remains outstanding.
(b) Portfolio primarily consists of nonrevolving home equity products.
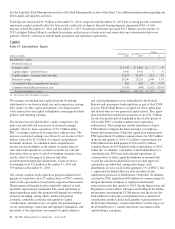
Purchased Impaired Loans – Accretable Difference
Sensitivity Analysis
The following table provides a sensitivity analysis on the
Total Purchased Impaired Loans portfolio. The analysis
reflects hypothetical changes in key drivers for expected cash
flows over the life of the loans under declining and improving
conditions at a point in time. Any unusual significant
economic events or changes, as well as other variables not
considered below (e.g., natural or widespread disasters), could
result in impacts outside of the ranges represented below.
Additionally, commercial and commercial real estate loan
settlements or sales proceeds can vary widely from appraised
values due to a number of factors including, but not limited to,
special use considerations, liquidity premiums and
improvements/deterioration in other income sources.
Table 12: Accretable Difference Sensitivity – Total
Purchased Impaired Loans
In billions
December 31,
2014
Declining
Scenario (a)
Improving
Scenario (b)
Expected cash flows $5.6 $(.2) $.2
Accretable difference 1.6 – –
Allowance for loan and lease
losses (.9) (.1) .2
(a) Declining Scenario – Reflects hypothetical changes that would decrease future cash
flow expectations. For consumer loans, we assume home price forecast decreases by
ten percent and unemployment rate forecast increases by two percentage points; for
commercial loans, we assume that collateral values decrease by ten percent.
(b) Improving Scenario – Reflects hypothetical changes that would increase future cash
flow expectations. For consumer loans, we assume home price forecast increases by
ten percent, unemployment rate forecast decreases by two percentage points and
interest rate forecast increases by two percentage points; for commercial loans, we
assume that collateral values increase by ten percent.
42 The PNC Financial Services Group, Inc. – Form 10-K