PNC Bank 2014 Annual Report Download - page 86
Download and view the complete annual report
Please find page 86 of the 2014 PNC Bank annual report below. You can navigate through the pages in the report by either clicking on the pages listed below, or by using the keyword search tool below to find specific information within the annual report.-
 1
1 -
2
-
3
-
4
-
5
-
6
-
7
-
8
-
9
-
10
-
11
-
12
-
13
-
14
-
15
-
16
-
17
-
18
-
19
-
20
-
21
-
22
-
23
-
24
-
25
-
26
-
27
-
28
-
29
-
30
-
31
-
32
-
33
-
34
-
35
-
36
-
37
-
38
-
39
-
40
-
41
-
42
-
43
-
44
-
45
-
46
-
47
-
48
-
49
-
50
-
51
-
52
-
53
-
54
-
55
-
56
-
57
-
58
-
59
-
60
-
61
-
62
-
63
-
64
-
65
-
66
-
67
-
68
-
69
-
70
-
71
-
72
-
73
-
74
-
75
-
 76
76 -
 77
77 -
 78
78 -
 79
79 -
 80
80 -
 81
81 -
 82
82 -
 83
83 -
 84
84 -
 85
85 -
 86
86 -
 87
87 -
 88
88 -
 89
89 -
 90
90 -
 91
91 -
 92
92 -
 93
93 -
 94
94 -
 95
95 -
 96
96 -
97
-
98
-
99
-
100
-
101
-
102
-
103
-
104
-
105
-
106
-
107
-
108
-
109
-
110
-
111
-
112
-
113
-
114
-
115
-
116
-
117
-
118
-
119
-
120
-
121
-
122
-
123
-
124
-
125
-
126
-
127
-
128
-
129
-
130
-
131
-
132
-
133
-
134
-
135
-
136
-
137
-
138
-
139
-
140
-
141
-
142
-
143
-
144
-
145
-
146
-
147
-
148
-
149
-
150
-
151
-
152
-
153
-
154
-
155
-
156
-
157
-
158
-
159
-
160
-
161
-
162
-
163
-
164
-
165
-
166
-
167
-
168
-
169
-
170
-
171
-
172
-
173
-
174
-
175
-
176
-
177
-
178
-
179
-
180
-
181
-
182
-
183
-
184
-
185
-
186
-
187
-
188
-
189
-
190
-
191
-
192
-
193
-
194
-
195
-
196
-
197
-
198
-
199
-
200
-
201
-
202
-
203
-
204
-
205
-
206
-
207
-
208
-
209
-
210
-
211
-
212
-
213
-
214
-
215
-
216
-
217
-
218
-
219
-
220
-
221
-
222
-
223
-
224
-
225
-
226
-
227
-
228
-
229
-
230
-
231
-
232
-
233
-
234
-
235
-
236
-
237
-
238
-
239
-
240
-
241
-
242
-
243
-
244
-
245
-
246
-
247
-
248
-
249
-
250
-
251
-
252
-
253
-
254
-
255
-
256
-
257
-
258
-
259
-
260
-
261
-
262
-
263
-
264
-
265
-
266
-
267
-
268
 |
 |
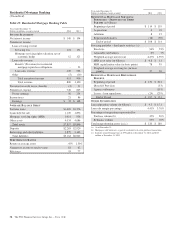
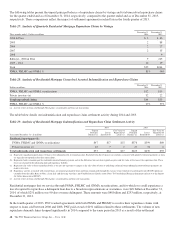
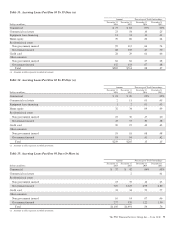
The following tables present the unpaid principal balance of repurchase claims by vintage and total unresolved repurchase claims
for the quarter ended and as of December 31, 2014, respectively, compared to the quarter ended and as of December 31, 2013,
respectively. These comparisons reflect the impact of settlement agreements reached late in the fourth quarter of 2013.
Table 27: Analysis of Quarterly Residential Mortgage Repurchase Claims by Vintage
Three months ended – Dollars in millions
December 31
2014
December 31
2013
2004 & Prior $3 $66
2005 288
2006 227
2007 235
2008 9
Subtotal – 2008 & Prior 9 225
2009 – 2014 16 19
Total $25 $244
FNMA, FHLMC and GNMA % 81% 96%
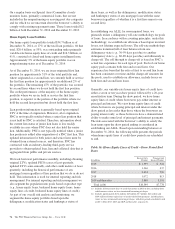
Table 28: Analysis of Residential Mortgage Unresolved Asserted Indemnification and Repurchase Claims
Dollars in millions
December 31
2014
December 31
2013
FNMA, FHLMC and GNMA securitizations $12 $13
Private investors (a) 32 22
Total unresolved claims $44 $35
FNMA, FHLMC and GNMA % 27% 37%
(a) Activity relates to loans sold through Non-Agency securitization and loan sale transactions.
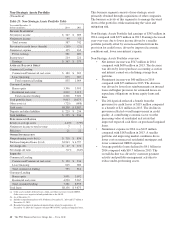
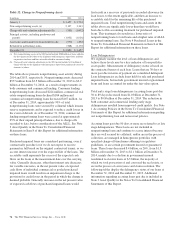
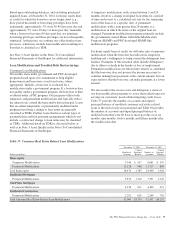
The table below details our indemnification and repurchase claim settlement activity during 2014 and 2013.
Table 29: Analysis of Residential Mortgage Indemnification and Repurchase Claim Settlement Activity
2014 2013
Year ended December 31 – In millions
Unpaid
Principal
Balance (a)
Losses
Incurred (b)
Fair Value of
Repurchased
Loans (c)
Unpaid
Principal
Balance (a)
Losses
Incurred (b)
Fair Value of
Repurchased
Loans (c)
Residential mortgages (d):
FNMA, FHLMC and GNMA securitizations $47 $17 $15 $378 $399 $89
Private investors (e) 10 7 2 47 31 6
Total indemnification and repurchase settlements $57 $24 $17 $425 $430 $95
(a) Represents unpaid principal balance of loans at the indemnification or repurchase date. Excluded from these balances are amounts associated with pooled settlement payments as loans
are typically not repurchased in these transactions.
(b) Represents both i) amounts paid for indemnification/settlement payments and ii) the difference between loan repurchase price and fair value of the loan at the repurchase date. These
losses are charged to the indemnification and repurchase liability.
(c) Represents fair value of loans repurchased only as we have no exposure to changes in the fair value of loans or underlying collateral when indemnification/settlement payments are
made to investors.
(d) Repurchase activity associated with insured loans, government-guaranteed loans and loans repurchased through the exercise of our removal of account provision (ROAP) option are
excluded from this table. Refer to Note 2 Loan Sale and Servicing Activities and Variable Interest Entities in the Notes To Consolidated Financial Statements in Item 8 of this Report
for further discussion of ROAPs.
(e) Activity relates to loans sold through Non-Agency securitizations and loan sale transactions.
Residential mortgages that we service through FNMA, FHLMC and GNMA securitizations, and for which we could experience a
loss if required to repurchase a delinquent loan due to a breach in representations or warranties, were $49 billion at December 31,
2014, of which $251 million was 90 days or more delinquent. These amounts were $48 billion and $253 million, respectively, at
December 31, 2013.
In the fourth quarter of 2013, PNC reached agreements with both FNMA and FHLMC to resolve their repurchase claims with
respect to loans sold between 2000 and 2008. PNC paid a total of $191 million related to these settlements. The volume of new
repurchase demand claims dropped significantly in 2014 compared to the same period in 2013 as a result of the settlement
68 The PNC Financial Services Group, Inc. – Form 10-K