PNC Bank 2014 Annual Report Download - page 186
Download and view the complete annual report
Please find page 186 of the 2014 PNC Bank annual report below. You can navigate through the pages in the report by either clicking on the pages listed below, or by using the keyword search tool below to find specific information within the annual report.-
 1
1 -
2
-
3
-
4
-
5
-
6
-
7
-
8
-
9
-
10
-
11
-
12
-
13
-
14
-
15
-
16
-
17
-
18
-
19
-
20
-
21
-
22
-
23
-
24
-
25
-
26
-
27
-
28
-
29
-
30
-
31
-
32
-
33
-
34
-
35
-
36
-
37
-
38
-
39
-
40
-
41
-
42
-
43
-
44
-
45
-
46
-
47
-
48
-
49
-
50
-
51
-
52
-
53
-
54
-
55
-
56
-
57
-
58
-
59
-
60
-
61
-
62
-
63
-
64
-
65
-
66
-
67
-
68
-
69
-
70
-
71
-
72
-
73
-
74
-
75
-
76
-
77
-
78
-
79
-
80
-
81
-
82
-
83
-
84
-
85
-
86
-
87
-
88
-
89
-
90
-
91
-
92
-
93
-
94
-
95
-
96
-
97
-
98
-
99
-
100
-
101
-
102
-
103
-
104
-
105
-
106
-
107
-
108
-
109
-
110
-
111
-
112
-
113
-
114
-
115
-
116
-
117
-
118
-
119
-
120
-
121
-
122
-
123
-
124
-
125
-
126
-
127
-
128
-
129
-
130
-
131
-
132
-
133
-
134
-
135
-
136
-
137
-
138
-
139
-
140
-
141
-
142
-
143
-
144
-
145
-
146
-
147
-
148
-
149
-
150
-
151
-
152
-
153
-
154
-
155
-
156
-
157
-
158
-
159
-
160
-
161
-
162
-
163
-
164
-
165
-
166
-
167
-
168
-
169
-
170
-
171
-
172
-
173
-
174
-
175
-
 176
176 -
 177
177 -
 178
178 -
 179
179 -
 180
180 -
 181
181 -
 182
182 -
 183
183 -
 184
184 -
 185
185 -
 186
186 -
 187
187 -
 188
188 -
 189
189 -
 190
190 -
 191
191 -
 192
192 -
 193
193 -
 194
194 -
 195
195 -
 196
196 -
197
-
198
-
199
-
200
-
201
-
202
-
203
-
204
-
205
-
206
-
207
-
208
-
209
-
210
-
211
-
212
-
213
-
214
-
215
-
216
-
217
-
218
-
219
-
220
-
221
-
222
-
223
-
224
-
225
-
226
-
227
-
228
-
229
-
230
-
231
-
232
-
233
-
234
-
235
-
236
-
237
-
238
-
239
-
240
-
241
-
242
-
243
-
244
-
245
-
246
-
247
-
248
-
249
-
250
-
251
-
252
-
253
-
254
-
255
-
256
-
257
-
258
-
259
-
260
-
261
-
262
-
263
-
264
-
265
-
266
-
267
-
268
 |
 |

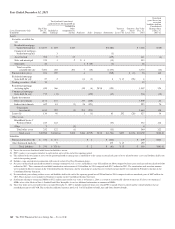
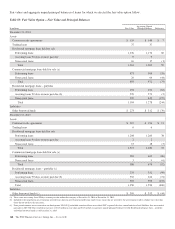
Fair values and aggregate unpaid principal balances of items for which we elected the fair value option follow.
Table 89: Fair Value Option – Fair Value and Principal Balances
In millions Fair Value
Aggregate Unpaid
Principal Balance Difference
December 31, 2014
Assets
Customer resale agreements $ 155 $ 148 $ 7
Trading loans 37 37
Residential mortgage loans held for sale
Performing loans 1,236 1,176 60
Accruing loans 90 days or more past due 9 9
Nonaccrual loans 16 17 (1)
Total 1,261 1,202 59
Commercial mortgage loans held for sale (a)
Performing loans 873 908 (35)
Nonaccrual loans 20 64 (44)
Total 893 972 (79)
Residential mortgage loans – portfolio
Performing loans 194 256 (62)
Accruing loans 90 days or more past due (b) 570 573 (3)
Nonaccrual loans 270 449 (179)
Total 1,034 1,278 (244)
Liabilities
Other borrowed funds $ 273 $ 312 $ (39)
December 31, 2013
Assets
Customer resale agreements $ 207 $ 196 $ 11
Trading loans 66
Residential mortgage loans held for sale
Performing loans 1,298 1,260 38
Accruing loans 90 days or more past due 2 2
Nonaccrual loans 15 18 (3)
Total 1,315 1,280 35
Commercial mortgage loans held for sale (a)
Performing loans 583 669 (86)
Nonaccrual loans 3 9 (6)
Total 586 678 (92)
Residential mortgage loans – portfolio (c)
Performing loans 233 332 (99)
Accruing loans 90 days or more past due (b) 552 626 (74)
Nonaccrual loans 365 598 (233)
Total 1,150 1,556 (406)
Liabilities
Other borrowed funds (c) $ 309 $ 353 $ (44)
(a) There were no accruing loans 90 days or more past due within this category at December 31, 2014 or December 31, 2013.
(b) Included in this population are government insured loans and non-government insured home equity loans. Loans that are insured by the government result in a higher fair value than
those that do not have that guarantee.
(c) Prior period amounts were corrected in our third quarter 2014 10-Q to include transferred loans over which PNC regained effective control and the related liabilities that are recorded
pursuant to ASC 860. This resulted in increases of $125 million in fair value and $128 million in aggregate unpaid principal balance for both Residential mortgage loans – portfolio
and Other borrowed funds as of December 31, 2013.
168 The PNC Financial Services Group, Inc. – Form 10-K