PNC Bank 2014 Annual Report Download - page 211
Download and view the complete annual report
Please find page 211 of the 2014 PNC Bank annual report below. You can navigate through the pages in the report by either clicking on the pages listed below, or by using the keyword search tool below to find specific information within the annual report.-
 1
1 -
2
-
3
-
4
-
5
-
6
-
7
-
8
-
9
-
10
-
11
-
12
-
13
-
14
-
15
-
16
-
17
-
18
-
19
-
20
-
21
-
22
-
23
-
24
-
25
-
26
-
27
-
28
-
29
-
30
-
31
-
32
-
33
-
34
-
35
-
36
-
37
-
38
-
39
-
40
-
41
-
42
-
43
-
44
-
45
-
46
-
47
-
48
-
49
-
50
-
51
-
52
-
53
-
54
-
55
-
56
-
57
-
58
-
59
-
60
-
61
-
62
-
63
-
64
-
65
-
66
-
67
-
68
-
69
-
70
-
71
-
72
-
73
-
74
-
75
-
76
-
77
-
78
-
79
-
80
-
81
-
82
-
83
-
84
-
85
-
86
-
87
-
88
-
89
-
90
-
91
-
92
-
93
-
94
-
95
-
96
-
97
-
98
-
99
-
100
-
101
-
102
-
103
-
104
-
105
-
106
-
107
-
108
-
109
-
110
-
111
-
112
-
113
-
114
-
115
-
116
-
117
-
118
-
119
-
120
-
121
-
122
-
123
-
124
-
125
-
126
-
127
-
128
-
129
-
130
-
131
-
132
-
133
-
134
-
135
-
136
-
137
-
138
-
139
-
140
-
141
-
142
-
143
-
144
-
145
-
146
-
147
-
148
-
149
-
150
-
151
-
152
-
153
-
154
-
155
-
156
-
157
-
158
-
159
-
160
-
161
-
162
-
163
-
164
-
165
-
166
-
167
-
168
-
169
-
170
-
171
-
172
-
173
-
174
-
175
-
176
-
177
-
178
-
179
-
180
-
181
-
182
-
183
-
184
-
185
-
186
-
187
-
188
-
189
-
190
-
191
-
192
-
193
-
194
-
195
-
196
-
197
-
198
-
199
-
200
-
 201
201 -
 202
202 -
 203
203 -
 204
204 -
 205
205 -
 206
206 -
 207
207 -
 208
208 -
 209
209 -
 210
210 -
 211
211 -
 212
212 -
 213
213 -
 214
214 -
 215
215 -
 216
216 -
 217
217 -
 218
218 -
 219
219 -
 220
220 -
 221
221 -
222
-
223
-
224
-
225
-
226
-
227
-
228
-
229
-
230
-
231
-
232
-
233
-
234
-
235
-
236
-
237
-
238
-
239
-
240
-
241
-
242
-
243
-
244
-
245
-
246
-
247
-
248
-
249
-
250
-
251
-
252
-
253
-
254
-
255
-
256
-
257
-
258
-
259
-
260
-
261
-
262
-
263
-
264
-
265
-
266
-
267
-
268
 |
 |

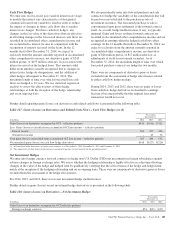
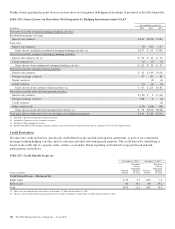
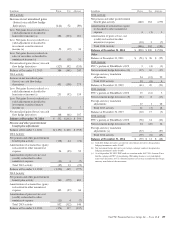
The notional amount of these credit default swaps by credit
rating is presented in the following table:
Table 132: Credit Ratings of Credit Default Swaps (a)
In millions
December 31,
2014
December 31,
2013
Credit Default Swaps – Purchased
Investment grade (b) $ 95 $95
Subinvestment grade (c) 15
Total $110 $95
(a) There were no credit default swaps sold as of December 31, 2014 and December 31,
2013.
(b) Investment grade with a rating of BBB-/Baa3 or above based on published rating
agency information.
(c) There were no subinvestment grade credit default swaps purchased as of
December 31, 2013. Subinvestment grade represents a rating below BBB-/Baa3
based on published rating agency information.
The referenced/underlying assets for these credit default
swaps are presented in the following table:
Table 133: Referenced/Underlying Assets of Credit Default
Swaps
December 31,
2014
December 31,
2013
Corporate debt 45% 37%
Commercial mortgage-backed
securities 55% 63%
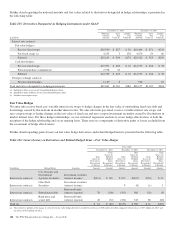
Risk Participation Agreements
We also periodically enter into risk participation agreements
to share some of the credit exposure with other counterparties
related to interest rate derivative contracts or to take on credit
exposure to generate revenue. We will make/receive payments
under these agreements if a customer defaults on its obligation
to perform under certain derivative swap contracts. Risk
participation agreements purchased and sold are included in
these derivative tables: Tables 129, 130, 134 and 135.
Further detail regarding the notional amount, fair value and
weighted-average remaining maturities in years for risk
participation agreements sold is presented in the following
table:
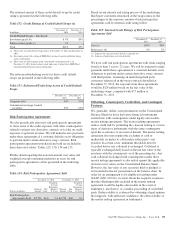
Table 134: Risk Participation Agreements Sold
December 31, 2014 December 31, 2013
Dollars in millions
Notional
Amount
Fair
Value
Weighted-
Average
Remaining
Maturity
In Years
Notional
Amount
Fair
Value
Weighted-
Average
Remaining
Maturity
In Years
Risk Participation
Agreements Sold $2,796 $(4) 5.4 $2,770 $(4) 6.1
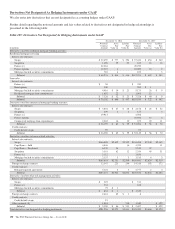
Based on our internal risk rating process of the underlying
third party customers referenced in the swap contracts, the
percentages of the exposure amount of risk participation
agreements sold by internal credit rating follow:
Table 135: Internal Credit Ratings of Risk Participation
Agreements Sold
December 31,
2014
December 31,
2013
Pass (a) 100% 98%
Below pass (b) 0% 2%
(a) Indicates the expected risk of default is currently low.
(b) Indicates a higher degree of risk of default.
We have sold risk participation agreements with terms ranging
from less than 1 year to 22 years. We will be required to make
payments under these agreements if a customer defaults on its
obligation to perform under certain derivative swap contracts
with third parties. Assuming all underlying third party
customers referenced in the swap contracts defaulted at
December 31, 2014, the exposure from these agreements
would be $124 million based on the fair value of the
underlying swaps, compared with $77 million at
December 31, 2013.
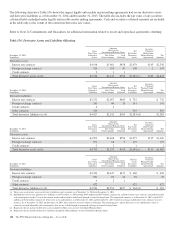
Offsetting, Counterparty Credit Risk, and Contingent
Features
We, generally, utilize a net presentation on the Consolidated
Balance Sheet for those derivative financial instruments
entered into with counterparties under legally enforceable
master netting agreements. The master netting agreements
reduce credit risk by permitting the closeout netting of various
types of derivative instruments with the same counterparty
upon the occurrence of an event of default. The master netting
agreement also may require the exchange of cash or
marketable securities to collateralize either party’s net
position. In certain cases, minimum thresholds must be
exceeded before any collateral is exchanged. Collateral is
typically exchanged daily based on the net fair value of the
positions with the counterparty as of the preceding day. Any
cash collateral exchanged with counterparties under these
master netting agreements is also netted against the applicable
derivative fair values on the Consolidated Balance Sheet.
However, the fair value of any securities held or pledged is
not included in the net presentation on the balance sheet. In
order for an arrangement to be eligible for netting under
GAAP (ASC 210-20), we must obtain the requisite assurance
that the offsetting rights included in the master netting
agreement would be legally enforceable in the event of
bankruptcy, insolvency, or a similar proceeding of such third
party. Enforceability is evidenced by obtaining a legal opinion
that supports, with sufficient confidence, the enforceability of
the master netting agreement in bankruptcy.
The PNC Financial Services Group, Inc. – Form 10-K 193