PNC Bank 2014 Annual Report Download - page 54
Download and view the complete annual report
Please find page 54 of the 2014 PNC Bank annual report below. You can navigate through the pages in the report by either clicking on the pages listed below, or by using the keyword search tool below to find specific information within the annual report.-
 1
1 -
2
-
3
-
4
-
5
-
6
-
7
-
8
-
9
-
10
-
11
-
12
-
13
-
14
-
15
-
16
-
17
-
18
-
19
-
20
-
21
-
22
-
23
-
24
-
25
-
26
-
27
-
28
-
29
-
30
-
31
-
32
-
33
-
34
-
35
-
36
-
37
-
38
-
39
-
40
-
41
-
42
-
43
-
 44
44 -
 45
45 -
 46
46 -
 47
47 -
 48
48 -
 49
49 -
 50
50 -
 51
51 -
 52
52 -
 53
53 -
 54
54 -
 55
55 -
 56
56 -
 57
57 -
 58
58 -
 59
59 -
 60
60 -
 61
61 -
 62
62 -
 63
63 -
 64
64 -
65
-
66
-
67
-
68
-
69
-
70
-
71
-
72
-
73
-
74
-
75
-
76
-
77
-
78
-
79
-
80
-
81
-
82
-
83
-
84
-
85
-
86
-
87
-
88
-
89
-
90
-
91
-
92
-
93
-
94
-
95
-
96
-
97
-
98
-
99
-
100
-
101
-
102
-
103
-
104
-
105
-
106
-
107
-
108
-
109
-
110
-
111
-
112
-
113
-
114
-
115
-
116
-
117
-
118
-
119
-
120
-
121
-
122
-
123
-
124
-
125
-
126
-
127
-
128
-
129
-
130
-
131
-
132
-
133
-
134
-
135
-
136
-
137
-
138
-
139
-
140
-
141
-
142
-
143
-
144
-
145
-
146
-
147
-
148
-
149
-
150
-
151
-
152
-
153
-
154
-
155
-
156
-
157
-
158
-
159
-
160
-
161
-
162
-
163
-
164
-
165
-
166
-
167
-
168
-
169
-
170
-
171
-
172
-
173
-
174
-
175
-
176
-
177
-
178
-
179
-
180
-
181
-
182
-
183
-
184
-
185
-
186
-
187
-
188
-
189
-
190
-
191
-
192
-
193
-
194
-
195
-
196
-
197
-
198
-
199
-
200
-
201
-
202
-
203
-
204
-
205
-
206
-
207
-
208
-
209
-
210
-
211
-
212
-
213
-
214
-
215
-
216
-
217
-
218
-
219
-
220
-
221
-
222
-
223
-
224
-
225
-
226
-
227
-
228
-
229
-
230
-
231
-
232
-
233
-
234
-
235
-
236
-
237
-
238
-
239
-
240
-
241
-
242
-
243
-
244
-
245
-
246
-
247
-
248
-
249
-
250
-
251
-
252
-
253
-
254
-
255
-
256
-
257
-
258
-
259
-
260
-
261
-
262
-
263
-
264
-
265
-
266
-
267
-
268
 |
 |

Average interest-earning deposits with banks, which are
primarily maintained with the Federal Reserve Bank,
increased significantly in the comparison to the prior year
period as we continued to enhance our liquidity position.
Average noninterest-earning assets decreased in 2014
compared with 2013, primarily reflecting lower unsettled
securities sales, partially offset by higher investment securities
valuation adjustments, both of which are included in
noninterest-earning assets for average balance sheet purposes.
Average total deposits increased $10.8 billion in 2014
compared with the prior year, driven by an increase of $12.1
billion in average transaction deposits, which grew to $189
billion in 2014. Higher average money market deposits,
average noninterest-bearing deposits, and average interest-
bearing demand deposits drove the increase in both
commercial and consumer average transaction deposits. These
increases were partially offset by a decrease of $2.6 billion in
average retail certificates of deposit attributable to runoff of
maturing accounts. Total deposits at December 31, 2014 were
$232.2 billion compared with $220.9 billion at December 31,
2013 and are further discussed within the Consolidated
Balance Sheet Review section of this Item 7.
Average total deposits represented 68% of average total assets
for 2014 and 69% for 2013.
Average borrowed funds increased in 2014 compared with
2013 primarily due to increases in average Federal Home
Loan Bank (FHLB) borrowings, average bank notes and
senior debt, and average subordinated debt, in part to enhance
our liquidity position. These increases were partially offset by
a decline in average commercial paper. Total borrowed funds
at December 31, 2014 were $56.8 billion compared with $46.1
billion at December 31, 2013 and are further discussed within
the Consolidated Balance Sheet Review section of this Item 7.
The Liquidity Risk Management portion of the Risk
Management section of this Item 7 includes additional
information regarding our borrowed funds.
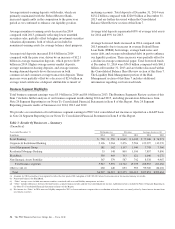
Business Segment Highlights
Total business segment earnings were $3.9 billion in 2014 and $4.0 billion in 2013. The Business Segments Review section of this
Item 7 includes further analysis of our business segment results during 2014 and 2013, including presentation differences from
Note 24 Segment Reporting in our Notes To Consolidated Financial Statements in Item 8 of this Report. Note 24 Segment
Reporting presents results of businesses for 2014, 2013 and 2012.
We provide a reconciliation of total business segment earnings to PNC total consolidated net income as reported on a GAAP basis
in Note 24 Segment Reporting in our Notes To Consolidated Financial Statements in Item 8 of this Report.
Table 3: Results Of Businesses – Summary
(Unaudited)
Year ended December 31 Net Income (a) Revenue Average Assets (a) (b)
In millions 2014 2013 2014 2013 2014 2013
Retail Banking $ 728 $ 550 $ 6,049 $ 6,100 $ 75,046 $ 74,971
Corporate & Institutional Banking 2,106 2,264 5,476 5,506 122,927 112,970
Asset Management Group 181 162 1,107 1,040 7,745 7,366
Residential Mortgage Banking 35 148 800 1,100 7,857 9,896
BlackRock 530 469 703 621 6,640 6,272
Non-Strategic Assets Portfolio 367 379 587 742 8,338 9,987
Total business segments 3,947 3,972 14,722 15,109 228,553 221,462
Other (c) (d) (e) 260 240 653 903 99,300 84,202
Total $4,207 $4,212 $15,375 $16,012 $327,853 $305,664
(a) Amounts for 2013 period have been updated to reflect the first quarter 2014 adoption of ASU 2014-01 related to investments in low income housing tax credits.
(b) Period-end balances for BlackRock.
(c) “Other” average assets include investment securities associated with asset and liability management activities.
(d) “Other” includes differences between the total business segment financial results and our total consolidated net income. Additional detail is included in Note 24 Segment Reporting in
the Notes To Consolidated Financial Statements in Item 8 of this Report.
(e) Net income for “Other” in 2014 increased slightly compared to 2013 as lower noninterest expense due to a reduction in benefits costs was mostly offset by lower interest income from
investment securities.
36 The PNC Financial Services Group, Inc. – Form 10-K