Wells Fargo 2011 Annual Report Download - page 96
Download and view the complete annual report
Please find page 96 of the 2011 Wells Fargo annual report below. You can navigate through the pages in the report by either clicking on the pages listed below, or by using the keyword search tool below to find specific information within the annual report.-
 1
1 -
2
-
3
-
4
-
5
-
6
-
7
-
8
-
9
-
10
-
11
-
12
-
13
-
14
-
15
-
16
-
17
-
18
-
19
-
20
-
21
-
22
-
23
-
24
-
25
-
26
-
27
-
28
-
29
-
30
-
31
-
32
-
33
-
34
-
35
-
36
-
37
-
38
-
39
-
40
-
41
-
42
-
43
-
44
-
45
-
46
-
47
-
48
-
49
-
50
-
51
-
52
-
53
-
54
-
55
-
56
-
57
-
58
-
59
-
60
-
61
-
62
-
63
-
64
-
65
-
66
-
67
-
68
-
69
-
70
-
71
-
72
-
73
-
74
-
75
-
76
-
77
-
78
-
79
-
80
-
81
-
82
-
83
-
84
-
85
-
 86
86 -
 87
87 -
 88
88 -
 89
89 -
 90
90 -
 91
91 -
 92
92 -
 93
93 -
 94
94 -
 95
95 -
 96
96 -
 97
97 -
 98
98 -
 99
99 -
 100
100 -
 101
101 -
 102
102 -
 103
103 -
 104
104 -
 105
105 -
 106
106 -
107
-
108
-
109
-
110
-
111
-
112
-
113
-
114
-
115
-
116
-
117
-
118
-
119
-
120
-
121
-
122
-
123
-
124
-
125
-
126
-
127
-
128
-
129
-
130
-
131
-
132
-
133
-
134
-
135
-
136
-
137
-
138
-
139
-
140
-
141
-
142
-
143
-
144
-
145
-
146
-
147
-
148
-
149
-
150
-
151
-
152
-
153
-
154
-
155
-
156
-
157
-
158
-
159
-
160
-
161
-
162
-
163
-
164
-
165
-
166
-
167
-
168
-
169
-
170
-
171
-
172
-
173
-
174
-
175
-
176
-
177
-
178
-
179
-
180
-
181
-
182
-
183
-
184
-
185
-
186
-
187
-
188
-
189
-
190
-
191
-
192
-
193
-
194
-
195
-
196
-
197
-
198
-
199
-
200
-
201
-
202
-
203
-
204
-
205
-
206
-
207
-
208
-
209
-
210
-
211
-
212
-
213
-
214
-
215
-
216
-
217
-
218
-
219
-
220
-
221
-
222
-
223
-
224
-
225
-
226
-
227
-
228
-
229
-
230
-
231
-
232
-
233
-
234
-
235
-
236
-
237
-
238
-
239
-
240
 |
 |

Critical Accounting Policies (continued)
information, including observable market data, indications of
market liquidity and orderliness, and our understanding of the
valuation techniques and significant inputs used. For securities
in inactive markets, we use a predetermined percentage to
evaluate the impact of fair value adjustments derived from
weighting both external and internal indications of value to
determine if the instrument is classified as Level 2 or Level 3.
Otherwise, the classification of Level 2 or Level 3 is based upon
the specific facts and circumstances of each instrument or
instrument category and judgments are made regarding the
significance of the Level 3 inputs to the instruments’ fair value
measurement in its entirety. If Level 3 inputs are considered
significant, the instrument is classified as Level 3.
Our financial assets valued using Level 3 measurements
consisted of certain asset-backed securities, including those
collateralized by auto leases or loans and cash reserves, private
collateralized mortgage obligations (CMOs), collateralized debt
obligations (CDOs), collateralized loan obligations (CLOs),
auction-rate securities, certain derivative contracts such as credit
default swaps related to CMO, CDO and CLO exposures and
certain MHFS and MSRs. For additional information on how we
value MSRs refer to the discussion earlier in this section.
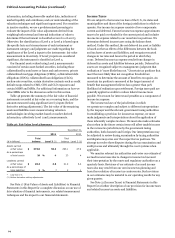
Table 46 presents the summary of the fair value of financial
instruments recorded at fair value on a recurring basis, and the
amounts measured using significant Level 3 inputs (before
derivative netting adjustments). The fair value of the remaining
assets and liabilities were measured using valuation
methodologies involving market-based or market-derived
information, collectively Level 1 and 2 measurements.
Table 46: Fair Value Level 3 Summary
December 31,
2011
2010
Total
Total
($ in billions)
balance
Level 3 (1)
balance
Level 3 (1)
Assets carried
at fair value
$
373.0
53.3
293.1
47.9
As a percentage
of total assets
28
%
4
23
4
Liabilities carried
at fair value
$
26.4
4.6
21.2
6.4
As a percentage of
total liabilities
2
%
*
2
1
*
Less than 1%
(1)
Before derivative netting adjustments.
See Note 17 (Fair Values of Assets and Liabilities) to Financial
Statements in this Report for a complete discussion on our use of
fair valuation of financial instruments, our related measurement
techniques and the impact to our financial statements.
Income Taxes
We are subject to the income tax laws of the U.S., its states and
municipalities and those of the foreign jurisdictions in which we
operate. Our income tax expense consists of two components:
current and deferred. Current income tax expense approximates
taxes to be paid or refunded for the current period and includes
income tax expense related to our uncertain tax positions. We
determine deferred income taxes using the balance sheet
method. Under this method, the net deferred tax asset or liability
is based on the tax effects of the differences between the book
and tax bases of assets and liabilities, and recognizes enacted
changes in tax rates and laws in the period in which they
occur. Deferred income tax expense results from changes in
deferred tax assets and liabilities between periods. Deferred tax
assets are recognized subject to management’s judgment that
realization is “more likely than not.” Uncertain tax positions that
meet the more likely than not recognition threshold are
measured to determine the amount of benefit to recognize. An
uncertain tax position is measured at the largest amount of
benefit that management believes has a greater than 50%
likelihood of realization upon settlement. Foreign taxes paid are
generally applied as credits to reduce federal income taxes
payable. We account for interest and penalties as a component of
income tax expense.
The income tax laws of the jurisdictions in which
we operate are complex and subject to different interpretations
by the taxpayer and the relevant government taxing authorities.
In establishing a provision for income tax expense, we must
make judgments and interpretations about the application of
these inherently complex tax laws. We must also make estimates
about when in the future certain items will affect taxable income
in the various tax jurisdictions by the government taxing
authorities, both domestic and foreign. Our interpretations may
be subjected to review during examination by taxing authorities
and disputes may arise over the respective tax positions. We
attempt to resolve these disputes during the tax examination and
audit process and ultimately through the court systems when
applicable.
We monitor relevant tax authorities and revise our estimate of
accrued income taxes due to changes in income tax laws and
their interpretation by the courts and regulatory authorities on a
quarterly basis. Revisions of our estimate of accrued income
taxes also may result from our own income tax planning and
from the resolution of income tax controversies. Such revisions
in our estimates may be material to our operating results for any
given quarter.
See Note 21 (Income Taxes) to Financial Statements in this
Report for a further description of our provision for income taxes
and related income tax assets and liabilities.
94