Wells Fargo 2011 Annual Report Download - page 235
Download and view the complete annual report
Please find page 235 of the 2011 Wells Fargo annual report below. You can navigate through the pages in the report by either clicking on the pages listed below, or by using the keyword search tool below to find specific information within the annual report.-
 1
1 -
2
-
3
-
4
-
5
-
6
-
7
-
8
-
9
-
10
-
11
-
12
-
13
-
14
-
15
-
16
-
17
-
18
-
19
-
20
-
21
-
22
-
23
-
24
-
25
-
26
-
27
-
28
-
29
-
30
-
31
-
32
-
33
-
34
-
35
-
36
-
37
-
38
-
39
-
40
-
41
-
42
-
43
-
44
-
45
-
46
-
47
-
48
-
49
-
50
-
51
-
52
-
53
-
54
-
55
-
56
-
57
-
58
-
59
-
60
-
61
-
62
-
63
-
64
-
65
-
66
-
67
-
68
-
69
-
70
-
71
-
72
-
73
-
74
-
75
-
76
-
77
-
78
-
79
-
80
-
81
-
82
-
83
-
84
-
85
-
86
-
87
-
88
-
89
-
90
-
91
-
92
-
93
-
94
-
95
-
96
-
97
-
98
-
99
-
100
-
101
-
102
-
103
-
104
-
105
-
106
-
107
-
108
-
109
-
110
-
111
-
112
-
113
-
114
-
115
-
116
-
117
-
118
-
119
-
120
-
121
-
122
-
123
-
124
-
125
-
126
-
127
-
128
-
129
-
130
-
131
-
132
-
133
-
134
-
135
-
136
-
137
-
138
-
139
-
140
-
141
-
142
-
143
-
144
-
145
-
146
-
147
-
148
-
149
-
150
-
151
-
152
-
153
-
154
-
155
-
156
-
157
-
158
-
159
-
160
-
161
-
162
-
163
-
164
-
165
-
166
-
167
-
168
-
169
-
170
-
171
-
172
-
173
-
174
-
175
-
176
-
177
-
178
-
179
-
180
-
181
-
182
-
183
-
184
-
185
-
186
-
187
-
188
-
189
-
190
-
191
-
192
-
193
-
194
-
195
-
196
-
197
-
198
-
199
-
200
-
201
-
202
-
203
-
204
-
205
-
206
-
207
-
208
-
209
-
210
-
211
-
212
-
213
-
214
-
215
-
216
-
217
-
218
-
219
-
220
-
221
-
222
-
223
-
224
-
 225
225 -
 226
226 -
 227
227 -
 228
228 -
 229
229 -
 230
230 -
 231
231 -
 232
232 -
 233
233 -
 234
234 -
 235
235 -
 236
236 -
 237
237 -
 238
238 -
 239
239 -
 240
240
 |
 |

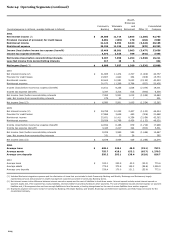
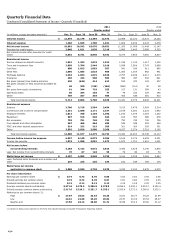
Average Balances, Yields and Rates Paid (Taxable-Equivalent Basis) – Quarterly (1)(2) – Unaudited
Quarter ended December 31,
2011
2010
Interest
Interest
Average
Yields/
income/
Average
Yields/
income/
(in millions)
balance
rates
expense
balance
rates
expense
Earning assets
Federal funds sold, securities purchased under
resale agreements and other short-term investments
$
67,968
0.52
%
$
89
72,029
0.40
%
$
74
Trading assets
45,521
3.57
407
33,871
3.56
302
Securities available for sale (3):
Securities of U.S. Treasury and federal agencies
8,708
0.99
22
1,597
2.80
12
Securities of U.S. states and political subdivisions
28,015
4.80
336
18,245
5.58
255
Mortgage-backed securities:
Federal agencies
84,332
3.68
776
76,674
4.48
859
Residential and commercial
34,717
7.05
612
31,060
10.95
850
Total mortgage-backed securities
119,049
4.66
1,388
107,734
6.35
1,709
Other debt and equity securities
47,278
4.38
518
35,492
6.15
545
Total securities available for sale
203,050
4.46
2,264
163,068
6.18
2,521
Mortgages held for sale (4)
44,842
4.07
456
45,063
4.39
495
Loans held for sale (4)
1,118
5.84
16
1,140
5.15
15
Loans:
Commercial:
Commercial and industrial
166,920
4.08
1,713
147,866
4.71
1,755
Real estate mortgage
105,219
4.26
1,130
99,188
3.85
961
Real estate construction
19,624
4.61
228
26,882
3.68
250
Lease financing
12,893
7.41
239
13,033
9.00
293
Foreign
38,740
2.39
233
30,986
3.57
279
Total commercial
343,396
4.10
3,543
317,955
4.42
3,538
Consumer:
Real estate 1-4 family first mortgage
229,746
4.74
2,727
228,802
5.06
2,901
Real estate 1-4 family junior lien mortgage
87,212
4.34
953
97,673
4.37
1,075
Credit card
21,933
12.96
711
21,888
13.44
736
Other revolving credit and installment
86,276
6.23
1,356
87,357
6.48
1,427
Total consumer
425,167
5.39
5,747
435,720
5.61
6,139
Total loans (4)
768,563
4.81
9,290
753,675
5.11
9,677
Other
4,671
4.32
50
5,338
3.93
51
Total earning assets
$
1,135,733
4.41
%
$
12,572
1,074,184
4.87
%
$
13,135
Funding sources
Deposits:
Interest-bearing checking
$
35,285
0.06
%
$
6
60,879
0.09
%
$
15
Market rate and other savings
485,127
0.14
175
431,171
0.25
266
Savings certificates
64,868
1.43
233
79,146
1.43
285
Other time deposits
12,868
1.85
60
13,438
2.00
67
Deposits in foreign offices
67,213
0.20
33
55,463
0.21
29
Total interest-bearing deposits
665,361
0.30
507
640,097
0.41
662
Short-term borrowings
48,742
0.14
17
50,609
0.24
31
Long-term debt
129,445
2.73
885
160,801
2.86
1,153
Other liabilities
12,166
2.60
80
8,258
3.13
65
Total interest-bearing liabilities
855,714
0.69
1,489
859,765
0.89
1,911
Portion of noninterest-bearing funding sources
280,019
-
-
214,419
-
-
Total funding sources
$
1,135,733
0.52
1,489
1,074,184
0.71
1,911
Net interest margin and net interest income on
a taxable-equivalent basis (5)
3.89
%
$
11,083
4.16
%
$
11,224
Noninterest-earning assets
Cash and due from banks
$
17,718
18,016
Goodwill
25,057
24,832
Other
128,220
120,005
Total noninterest-earning assets
$
170,995
162,853
Noninterest-bearing funding sources
Deposits
$
246,692
197,943
Other liabilities
63,556
52,930
Total equity
140,766
126,399
Noninterest-bearing funding sources used to
fund earning assets
(280,019)
(214,419)
Net noninterest-bearing funding sources
$
170,995
162,853
Total assets
$
1,306,728
1,237,037
(1) Our average prime rate was 3.25% for the quarters ended December 31, 2011 and 2010. The average three-month London Interbank Offered Rate (LIBOR) was 0.48%
and 0.29% for the same quarters, respectively.
(2) Yields/rates and amounts include the effects of hedge and risk management activities associated with the respective asset and liability categories.
(3) Yields and rates are based on interest income/expense amounts for the period, annualized based on the accrual basis for the respective accounts. The average balance
represent amortized cost and the previously reported average balance amounts for all periods prior to 2011 have been changed to amortized cost, the basis used to
determine yield for those periods.
(4) Nonaccrual loans and related income are included in their respective loan categories.
(5) Includes taxable-equivalent adjustments of $191 million and $161 million for the quarters ended December 31, 2011 and 2010, respectively primarily related to tax-
exempt income on certain loans and securities. The federal statutory tax rate was 35% for the periods presented.
233