Wells Fargo 2011 Annual Report Download - page 205
Download and view the complete annual report
Please find page 205 of the 2011 Wells Fargo annual report below. You can navigate through the pages in the report by either clicking on the pages listed below, or by using the keyword search tool below to find specific information within the annual report.-
 1
1 -
2
-
3
-
4
-
5
-
6
-
7
-
8
-
9
-
10
-
11
-
12
-
13
-
14
-
15
-
16
-
17
-
18
-
19
-
20
-
21
-
22
-
23
-
24
-
25
-
26
-
27
-
28
-
29
-
30
-
31
-
32
-
33
-
34
-
35
-
36
-
37
-
38
-
39
-
40
-
41
-
42
-
43
-
44
-
45
-
46
-
47
-
48
-
49
-
50
-
51
-
52
-
53
-
54
-
55
-
56
-
57
-
58
-
59
-
60
-
61
-
62
-
63
-
64
-
65
-
66
-
67
-
68
-
69
-
70
-
71
-
72
-
73
-
74
-
75
-
76
-
77
-
78
-
79
-
80
-
81
-
82
-
83
-
84
-
85
-
86
-
87
-
88
-
89
-
90
-
91
-
92
-
93
-
94
-
95
-
96
-
97
-
98
-
99
-
100
-
101
-
102
-
103
-
104
-
105
-
106
-
107
-
108
-
109
-
110
-
111
-
112
-
113
-
114
-
115
-
116
-
117
-
118
-
119
-
120
-
121
-
122
-
123
-
124
-
125
-
126
-
127
-
128
-
129
-
130
-
131
-
132
-
133
-
134
-
135
-
136
-
137
-
138
-
139
-
140
-
141
-
142
-
143
-
144
-
145
-
146
-
147
-
148
-
149
-
150
-
151
-
152
-
153
-
154
-
155
-
156
-
157
-
158
-
159
-
160
-
161
-
162
-
163
-
164
-
165
-
166
-
167
-
168
-
169
-
170
-
171
-
172
-
173
-
174
-
175
-
176
-
177
-
178
-
179
-
180
-
181
-
182
-
183
-
184
-
185
-
186
-
187
-
188
-
189
-
190
-
191
-
192
-
193
-
194
-
 195
195 -
 196
196 -
 197
197 -
 198
198 -
 199
199 -
 200
200 -
 201
201 -
 202
202 -
 203
203 -
 204
204 -
 205
205 -
 206
206 -
 207
207 -
 208
208 -
 209
209 -
 210
210 -
 211
211 -
 212
212 -
 213
213 -
 214
214 -
 215
215 -
216
-
217
-
218
-
219
-
220
-
221
-
222
-
223
-
224
-
225
-
226
-
227
-
228
-
229
-
230
-
231
-
232
-
233
-
234
-
235
-
236
-
237
-
238
-
239
-
240
 |
 |

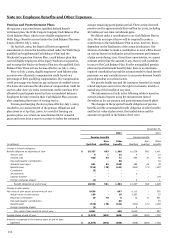
Alternative Investments
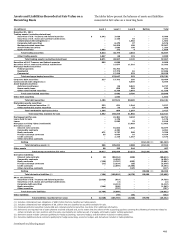
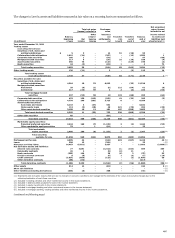
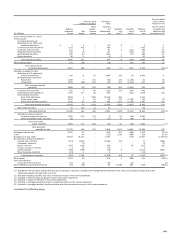
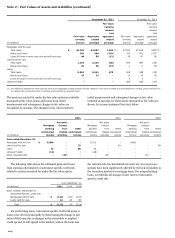
The following table summarizes our investments in various types
of funds, which are included in trading assets, securities
available for sale and other assets. We use the funds’ net asset
values (NAVs) per share as a practical expedient to measure fair
value on recurring and nonrecurring bases. The fair values
presented in the table are based upon the funds’ NAVs or an
equivalent measure.
Redemption
Fair
Unfunded
Redemption
notice
(in millions)
value
commitments
frequency
period
December 31, 2011
Offshore funds
$
352
-
Daily - Annually
1 - 180 days
Funds of funds
1
-
Quarterly
90 days
Hedge funds
22
-
Daily - Annually
5 - 95 days
Private equity funds
976
240
N/A
N/A
Venture capital funds
83
28
N/A
N/A
Total
$
1,434
268
December 31, 2010
Offshore funds
$
1,665
-
Daily - Annually
1 - 180 days
Funds of funds
63
-
Monthly - Quarterly
10 - 90 days
Hedge funds
23
-
Monthly - Annually
30 - 120 days
Private equity funds
1,830
669
N/A
N/A
Venture capital funds
88
36
N/A
N/A
Total
$
3,669
705
N/A - Not applicable
Offshore funds primarily invest in investment grade
European fixed-income securities. Redemption restrictions are
in place for investments with a fair value of $200 million and
$74 million at December 31, 2011 and 2010, respectively, due to
lock-up provisions that will remain in effect until October 2015.
Private equity funds invest in equity and debt securities
issued by private and publicly-held companies in connection
with leveraged buyouts, recapitalizations and expansion
opportunities. Substantially all of these investments do not allow
redemptions. Alternatively, we receive distributions as the
underlying assets of the funds liquidate, which we expect to
occur over the next nine years.
Venture capital funds invest in domestic and foreign
companies in a variety of industries, including information
technology, financial services and healthcare. These investments
can never be redeemed with the funds. Instead, we receive
distributions as the underlying assets of the fund liquidate,
which we expect to occur over the next six years.
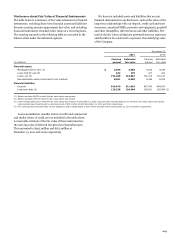
Fair Value Option
We measure MHFS at fair value for prime MHFS originations
for which an active secondary market and readily available
market prices exist to reliably support fair value pricing models
used for these loans. Loan origination fees on these loans are
recognized when earned, and related direct loan origination
costs are recognized when incurred. We also measure at fair
value certain of our other interests held related to residential
loan sales and securitizations. We believe fair value
measurement for prime MHFS and other interests held, which
we hedge with free-standing derivatives (economic hedges)
along with our MSRs, measured at fair value, reduces certain
timing differences and better matches changes in the value of
these assets with changes in the value of derivatives used as
economic hedges for these assets.
Upon the acquisition of Wachovia, we elected to measure at
fair value certain portfolios of LHFS that may be economically
hedged with derivative instruments. In addition, we elected to
measure at fair value certain letters of credit that are hedged
with derivative instruments to better reflect the economics of the
transactions. These letters of credit are included in trading
account assets or liabilities.
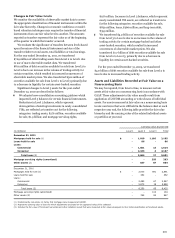
Upon the adoption of new consolidation guidance on January
1, 2010, we elected to measure at fair value the eligible assets
(loans) and liabilities (long-term debt) of certain nonconforming
mortgage loan securitization VIEs. We elected the fair value
option for such newly consolidated VIEs to continue fair value
accounting as our interests prior to consolidation were
predominantly carried at fair value with changes in fair value
recognized in earnings. Upon clarifying guidance from the SEC
during fourth quarter 2011, we consolidated reverse mortgage
loans previously sold under a GNMA securitization program. We
had initially elected fair value option on these loans prior to sale,
and, as such, they were consolidated under fair value option.
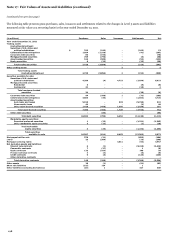
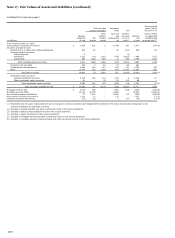
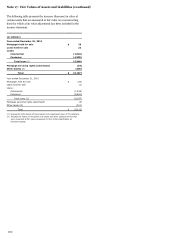
The following table reflects the differences between fair value
carrying amount of certain assets and liabilities for which we
have elected the fair value option and the contractual aggregate
unpaid principal amount at maturity.
203